- Bloomberg has criticized Charlie Lee for selling his entire Litecoin portfolio a year ago, and thus avoiding the 90% price plummet.
- Litecoin has recently teamed up with X-9 Dev team to bring one-click atomic swap payments to the Lightning Network.
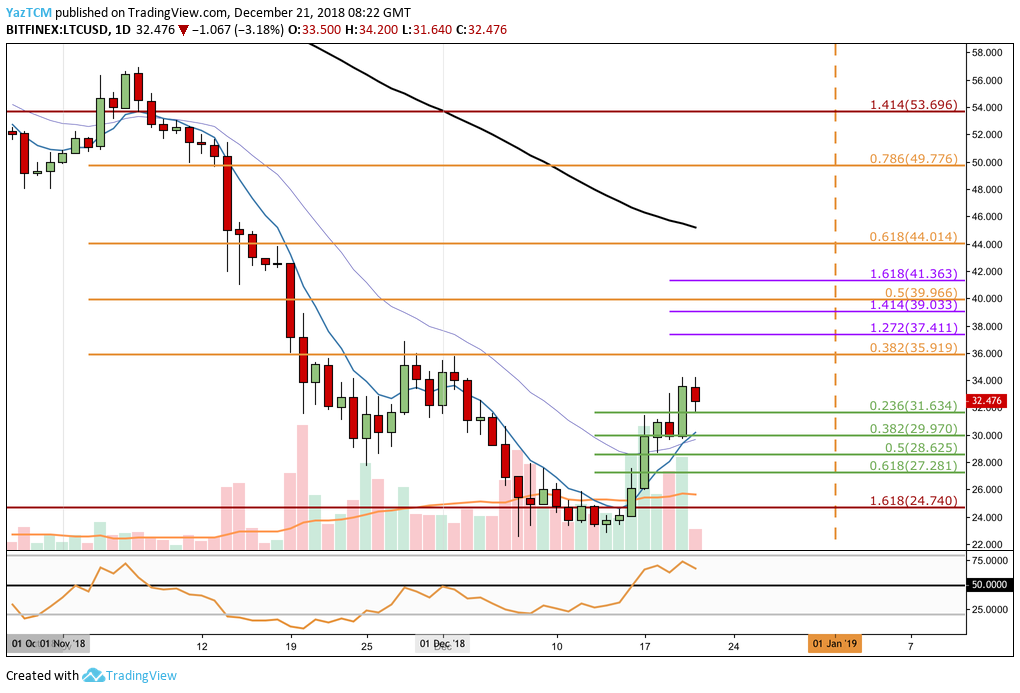
- Support moving forward: $31.63, $29.97, $28.62, $27.28, $26, $24.74.
- Resistance moving forward: $34.00, $35.91, $37.41, $39.03, $39.96, $41.36, $44.01, $49.77.
Latest Litecoin News
Charlie Lee, the founder of Litecoin, has been under fire recently for something he did almost a year ago.
Lee was criticized in a Bloomberg article which highlighted the fact he had sold all of his Litecoin stash a few days after the cryptocurrency had peaked to its all-time high value, around $375. By doing so, Lee avoided the 90% price decline of LTC while investors are left to experience the losses.
Lee had cited a “conflict of interest” as his reasons for selling his LTC holdings as he was profiting each time price action increased while he was working on the project.
He didn’t want his personal tweets to be interpreted as him trying to move the price higher for his own financial gains. Thus, he elected to sell his entire Litecoin portfolio at an average trade of $200 per Litecoin.
Bloomberg’s criticisms center around the fact that transactions have continuously fallen since he sold, and adoption has not increased at all.
In other Litecoin news, the Litecoin Foundation announced their collaboration with the X-9 Developer team to improve the maintenance of the LTCD alternative full node implementation. The X-9 team aims to improve the clunky user experience of the Lightning Network, and want to develop a “one-click” solution for Lightning Network Atomic Swaps.
Now, let’s take a look at Litecoin price action over the short term and highlight any potential areas of support and resistance moving forward.
LTC Price Analysis
Litecoin has seen a 4.46% price increase over the past 24 hours of trading and a further significant 36.01% price surge over the past 7 trading days. The cryptocurrency is now exchanging hands at a price around $32.24, at the time of writing.
Litecoin is now ranked 8th and holds a $1.91 billion market cap valuation. After seeing a steep 45% price decline over the previous 90-day trading period, the 68-month old cryptocurrency project is trading at a value that is 91% lower than the all-time high price.
Analyzing the market from the short-term perspective above, we can see that LTC/USD had fallen slightly below our downside 1.618 Fibonacci Extension level (drawn in red) priced at $24.70. Then it found support around the $23.00 area before rebounding.
After the bounce, the market went on to surge for the following few days until it met resistance around the $34.00 handle.
Price action has retraced slightly today, but had found support at the short-term .236 Fibonacci Retracement level (drawn in green) priced at $31.63
Trend: Bullish Above $37
The market has seen a much-needed bull run over the last week of trading. However, the long-term trend is still considered bearish until price action can break above the previous high around $37.00.
If LTC/USD breaks above $37.00, we can confidently consider that the trend has reversed and that the market will be heading higher.
Where is the Resistance for LTC Above the $34 Handle?
If the buyers can climb above the near-term resistance around the $34 handle, we can expect immediate higher resistance to be located at the bearish .382 Fibonacci Retracement level (drawn in orange) priced at $35.91.
This Fibonacci Retracement is measured from the entire market collapse seen during November to the recent price rebound at the $23.00 handle.
Further resistance above $36 can be located at the short-term 1.272 and 1.414 Fibonacci Extension levels (drawn in purple), priced at $37.41 and $39.03.
Resistance above here can be expected at the short-term 1.618 Fibonacci Extension level (drawn in purple) priced at $41.36, closely followed by the bearish .618 Fibonacci Retracement level (drawn in orange) priced at $44.01.
What If the Sellers Push LTC Below the Support at $31.63?
If the bears push the market below $31.63, immediate support toward the downside can be located at the short-term .382 and .5 FIbonacci Retracement levels (drawn in green), priced at $29.97 and $28.62 respectively.
Further support expected below can be then found at the .618 Fibonacci Retracement level (drawn in green) priced at $27.28, followed by the downside 1.618 Fibonacci Extension level (drawn in red) priced at $24.74.
What Are the Technical Indicators Showing?
The RSI has broken above the 50 handle which indicates that the bulls have taken control of the momentum within the market. So long as the RSI can remain above the 50 handle on the retrace, we could expect the market to continue to travel higher.
Similarly, the 7-day EMA (blue moving average) has crossed above the 21-day EMA (purple moving average) to signal a bullish crossover. If these two moving averages can diverge away from each other, we could expect to see LTC/USD move higher.
Conclusion
It seems that Charlie Lee cannot escape the criticism of his decision to sell all his Litecoin. However, the criticism is not wholly justified as nobody really can tell when the market has peaked.
Nonetheless, Lee has proven his dedication to the project as he is still working on Litecoin full time a year after his decision to sell his holdings.


