- Brave browser has recently been ranked as the most energy-efficient mobile browser on the market.
- Price action for BAT is currently holding above the $0.14 handle.
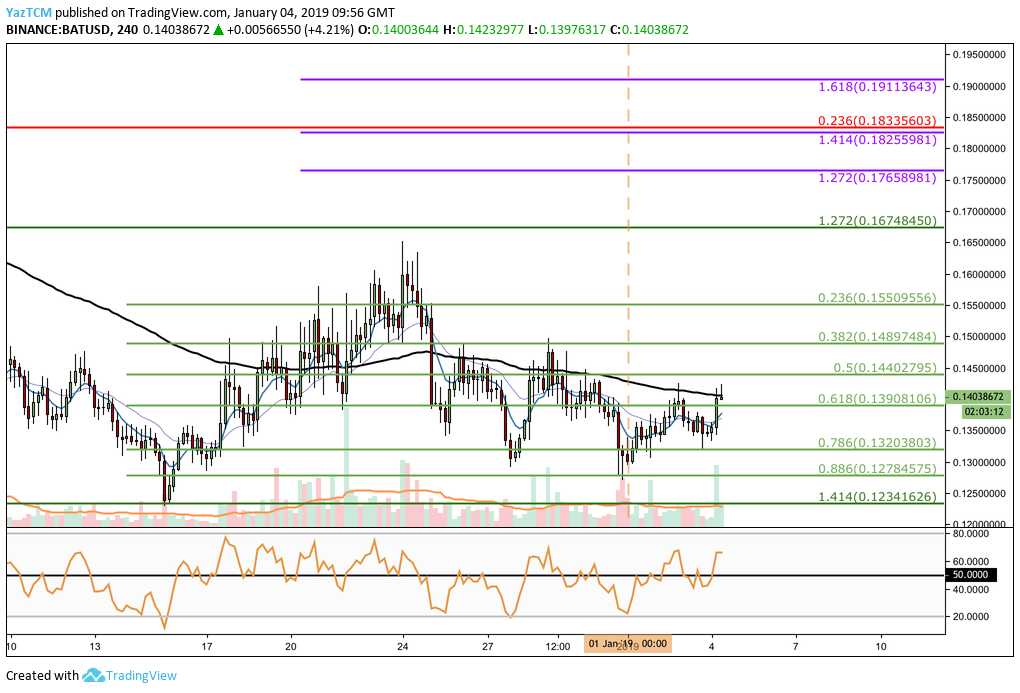
- Support moving forward: $0.1390, $0.1320, $0.1278, $0.1234.
- Resistance moving forward: $0.14402, $0.1489, $0.15509, $0.1674, $0.1765, $0.1825.
Latest Brave Browser News
After reaching over 10 million downloads and having over 4 million active users, the Brave browser continues to dominate headlines. Brave was also selected to become the default browser on the blockchain-based HTC Exodus smartphone, further adding to its already established user base.
In a new report by Greenspector, the mobile Brave browser has been ranked in the top position based on its energy efficiency.
Mobile browsers are one of the most used applications on smartphones. Used for gathering news, browsing daily articles and more, the browser is usually one of the most energy-draining applications on any smartphone. Therefore, it is important to select an efficient browser that will help to reduce battery drain and prolong the life of the smartphone’s battery.
The Greenspector report showed that Brave is the most energy-efficient browser out of all the browsers tested, proving 7 hours and 26 minutes of continuous usage. This may largely be due to the ad blocking and cookie disabling features that the browser implements as it is a privacy-focused browser.
Firefox Focus ranked in second place, with a close 7 hours and 23 minutes of continued usage, and the rather unknown Dolphin browser came in 3rd with just under 7 hours and 15 minutes of continuous browser usage.
Surprisingly, the widely-used and popular Google Chrome browser finished in the bottom 3, at 7th place. It allowed for only 6 hours and 25 minutes of usage over the testing period. This may be due to the fact that the browser does not implement any privacy-focused techniques to keep their users protected.
This is a significant achievement for the Brave team as they continue to develop a strong browser that allows their users to retain their privacy
Let us continue to take a look at the BAT/USD market over the short term and highlight any potential areas of support and resistance moving forward.
BAT Price Analysis
Basic Attention Token (BAT) has seen a price increase totaling 4.49% over the past 24 hours of trading as the token is now exchanging hands at $0.1403, at the time of writing. The market has seen a further 5% increase over the past 7 trading days but has suffered a price drop totaling almost 9% over the past trading month.
BAT now is ranked in 32nd position with a total market cap value of $168.89 million. The 19-month old coin has seen a rather muted (relative to its competitors) 24% price fall over the past 90 trading days. It now trades at a value that is 84% lower than the all-time high value.
Looking at the 4-hour BAT/USD chart above, we can see that the market had rebounded from the yearly low around the support provided by the downside 1.414 Fibonacci Extension level (drawn in dark green) priced at $0.1234.
Price action then went onto rally from this support area during the second half of December 2018 to reach a high of $0.1653 before retracing once again. The market continued to fall until it found support at the short-term .886 Fibonacci Retracement level (drawn in green) priced at $0.1278 toward the end of December 2018.
Price action has since attempted to travel higher but has only managed to break above the short-term .618 Fibonacci Retracement level (drawn in green) priced at $0.1390 as it presently is exchanging hands around $0.1390.
Trend: Neutral
The market is currently in a short-term bearish trend.
However, for a long-term bullish trend to be established price action must break below the $0.12 handle. Currently the trend can be considered neutral as the market is in a phase of consolidation once again.
For the trend to be considered bullish, we would need to see price action break above the $0.1650 handle once again.
Where is the Support for BAT Below the $0.14 Level?
If the sellers continue to drive price action lower for BAT/USD, we can expect immediate support toward the downside to be located at the short-term .618 and .786 Fibonacci Retracement levels (drawn in green), priced at $0.1390 and $0.1320 respectively.
If price action continues to head even lower, we can expect more support toward the downside to be located at the short-term .886 Fibonacci Retracement level (drawn in green) priced at $0.1278. This is followed by the previous downside 1.414 Fibonacci Extension level (drawn in dark green) priced at $0.1234.
Where is the Resistance Above $0.14?
If the bulls can keep price action above the $0.14 handle and push the market higher, they will encounter immediate resistance above at the short-term .5 Fibonacci Retracement level (drawn in green) priced at $0.14402.
Further resistance above this can then be expected at the short-term .382 and .236 Fibonacci Retracement levels (drawn in green), priced at $0.1489 and $0.15509 respectively.
If the buyers can continue to drive price action above the December 2018 high and break above the $0.16 handle, we can expect further higher resistance to be located at the short-term 1.272 and 1.414 Fibonacci Extension levels (drawn in purple), priced at $0.1765 and $0.1825 respectively.
Conclusion
The Brave team continues to prove that they are making significant progress within their browser application. The latest statistics prove that the mobile Brave browser is significantly better than all of its assessed rivals.
As the user base grows and the advertising plans begin to roll out for Brave, the BAT token could continue to increase its adoption rate as the use case improves.


