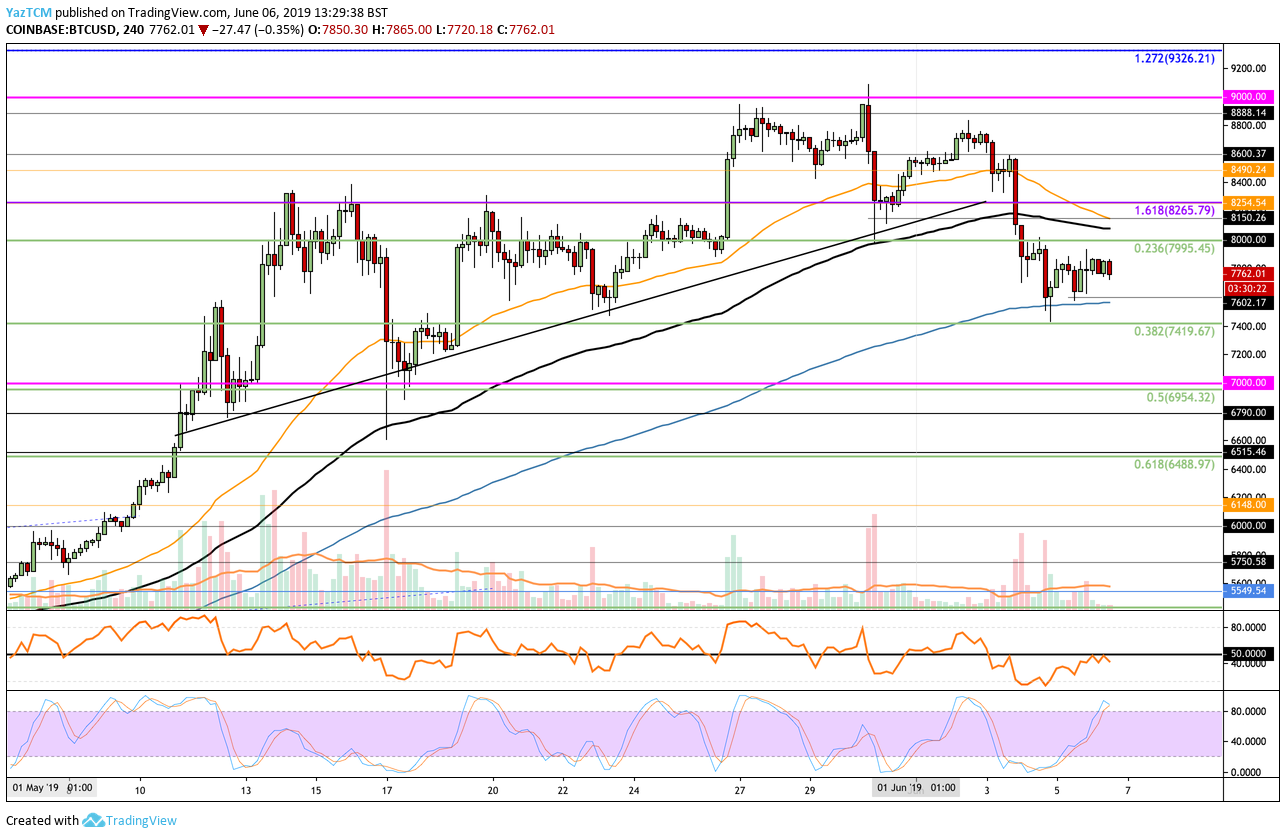
Bitcoin has finally seen some potential for a rebound after seeing some green over the past 24 hours of trading, as the cryptocurrency is currently trading around the $7,760 level. The cryptocurrency started falling lower when it hit resistance at the $9,000 level – losing almost 10% over the past 7 trading days – to drop into strong support at the $7,419 level.
The support at $7,419 is provided by a short-term .382 FIbonacci Retracement, and it looks like it could be a good level of support for the rebound to occur at.

Source: CoinCheckup
In this article, we will take a look at how soon Bitcoin may be able to rebound and head back above the $8,000 level once again. We believe that if the support at $7,419 holds, we should see Bitcoin rebounding back above $8,000 within the next few days.
Bitcoin is currently holding a $139 billion market cap valuation after BTC managed to surge by a total of 35% over the past 30 days of trading. Furthermore, Bitcoin has now seen a 99% price explosion over the past 3 months, which puts the bulls on a very strong footing.
Let us take a look at the BTC/USD market and highlight some potential areas of resistance moving forward.
Bitcoin Price Analysis
BTC/USD – MEDIUM TERM – 4HR CHART

What Has Been Going On?
Taking a look at the 4-hr BTC/USD chart above, we can see that Bitcoin attempted to break above the $9,000 level toward the end of May, but was unfortunately unable to do so. The cryptocurrency then went on to drop throughout the first few days of June 2019, falling beneath the support at $8,500 and $8,000.
However, very recently, we can see that BTC/USD fell into support at the short-term .382 Fibonacci Retracement level (drawn in green), priced at $7,419, and went on to rebound sharply. Bitcoin is now trading higher at a price of around $7,762 at the time of writing.
What Is the Current Short-Term Trend?
The current short-term trend remains bullish for Bitcoin. However, if price action was to drop further and fall beneath the support at the $7,419 level, we could consider the short-term bullish market to be invalidated and could then consider the market as neutral.
For the long-term bullish trend to be invalidated, we would need to usee BTC/USD collapse beneath the $7,000 level.
Where Is the Resistance Toward $8,000?
If the buyers begin to increase their pressure and push the market higher, we can expect immediate resistance above the market to be located at the $8,780 level. Bitcoin has struggled over the past few hours to break above this resistance. Above $8,780, we can expect further higher resistance to then be located at the $7,995 level. If the buyers can clear this, they will be clear to make an attempt at the $8,000 target level.
Above $8,000, further higher resistance is then located at $8,265, $8,400, $8,490, $8,600, $8,888, and $9,000.
What If the Sellers Regain Control?
Alternatively, if the sellers regroup and push the market lower, we can expect immediate support beneath the market to be located at the $7,419 support level. Beneath this, further support is expected at the $7,000 level.
If the selling continued beneath $7,000, further support below can be located at $6,954, $6,790, and $6,515.
Conclusion
Bitcoin may have seen a sharp price decline from the $9,000 resistance level over the past week. However, this does not change the fact that the market remains bullish over the longer term. If BTC/USD can hold the support around $7,490, we can expect Bitcoin to rebound and head above the $8,000 level in the coming days.

