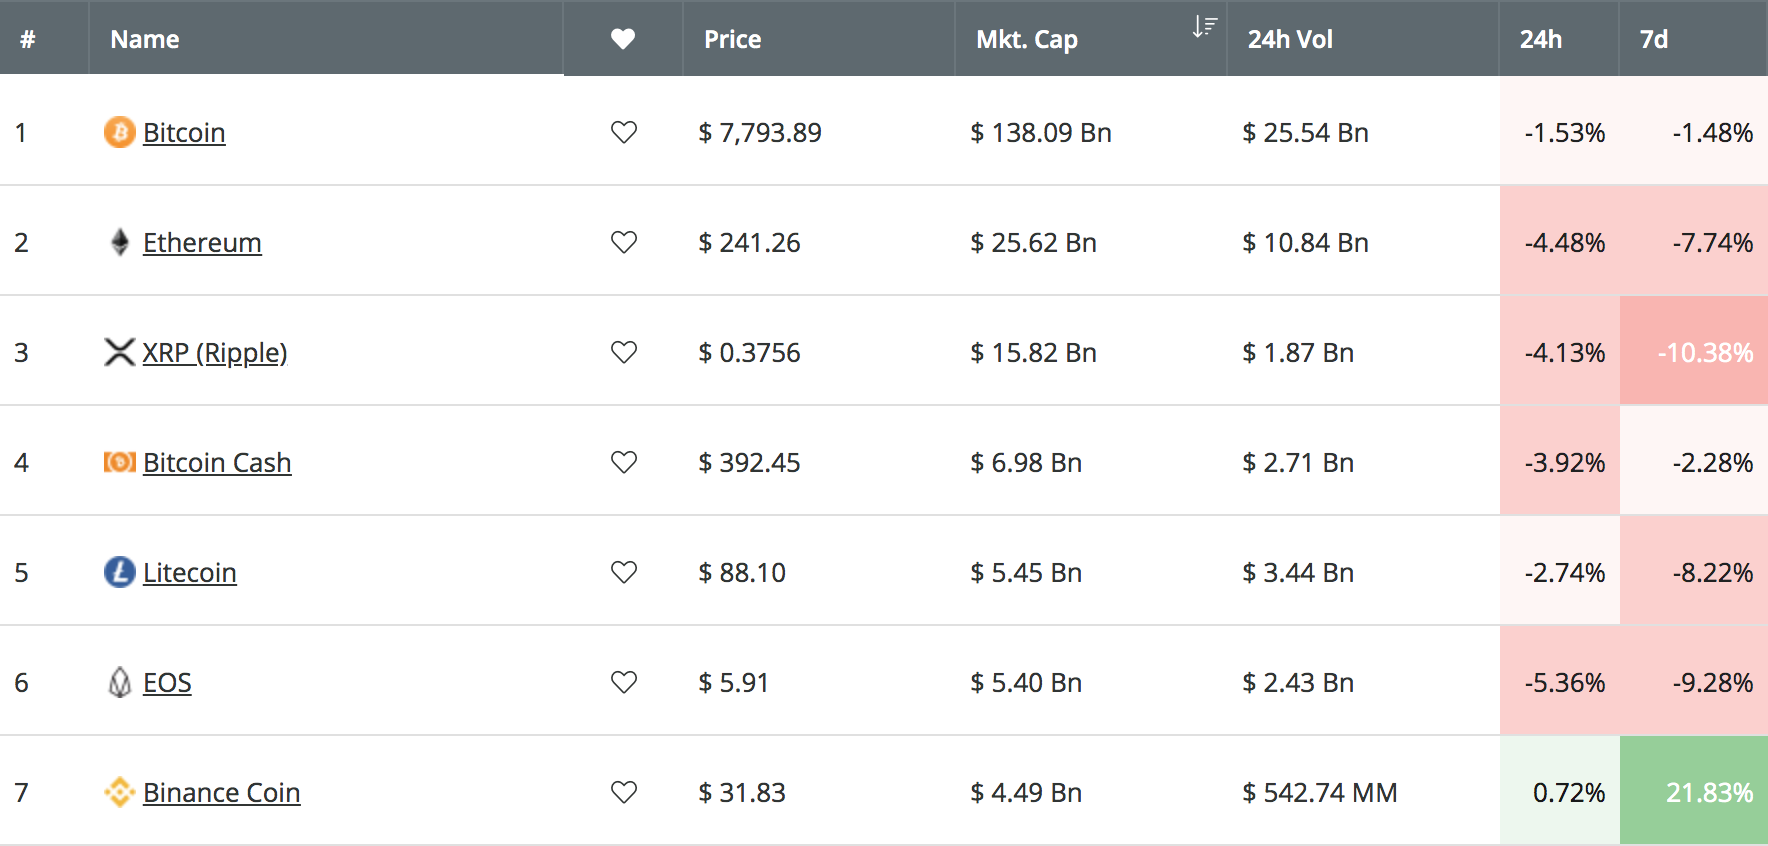
The cryptocurrency markets have seen a brief period of consolidation after the recent Bitcoin pullback from the $8,000 level, causing most cryptocurrencies to show red returns between 7-10% over the past 7 trading days.
However, among the top-flight cryptocurrency projects, there is one that is resilient and has barely suffered. Binance Coin has seen a price increase totaling 21.83% over the past 7 trading days, bringing the price for the coin up to around $31.83, whilst the rest of the cryptocurrency market suffers.

Source: CoinCheckup
Furthermore, over the past 30 trading days, Binance Coin has seen an increase of 33%, with a further massive price explosion totaling 195% over the past 90 trading days. Binance Coin is now ranked in 7th position in the market cap rankings, as it presently holds a $4.49 billion market cap value. However, Binance Coin is now creeping up toward 6th position holder EOS’ market cap value of $5.40 billion.
Let us continue to take a look at the Binance Coin market and highlight some potential areas of support and resistance moving forward.
Binance Coin Price Analysis
BNB/USD – MEDIUM TERM – DAILY CHART

What Has Been Going On?
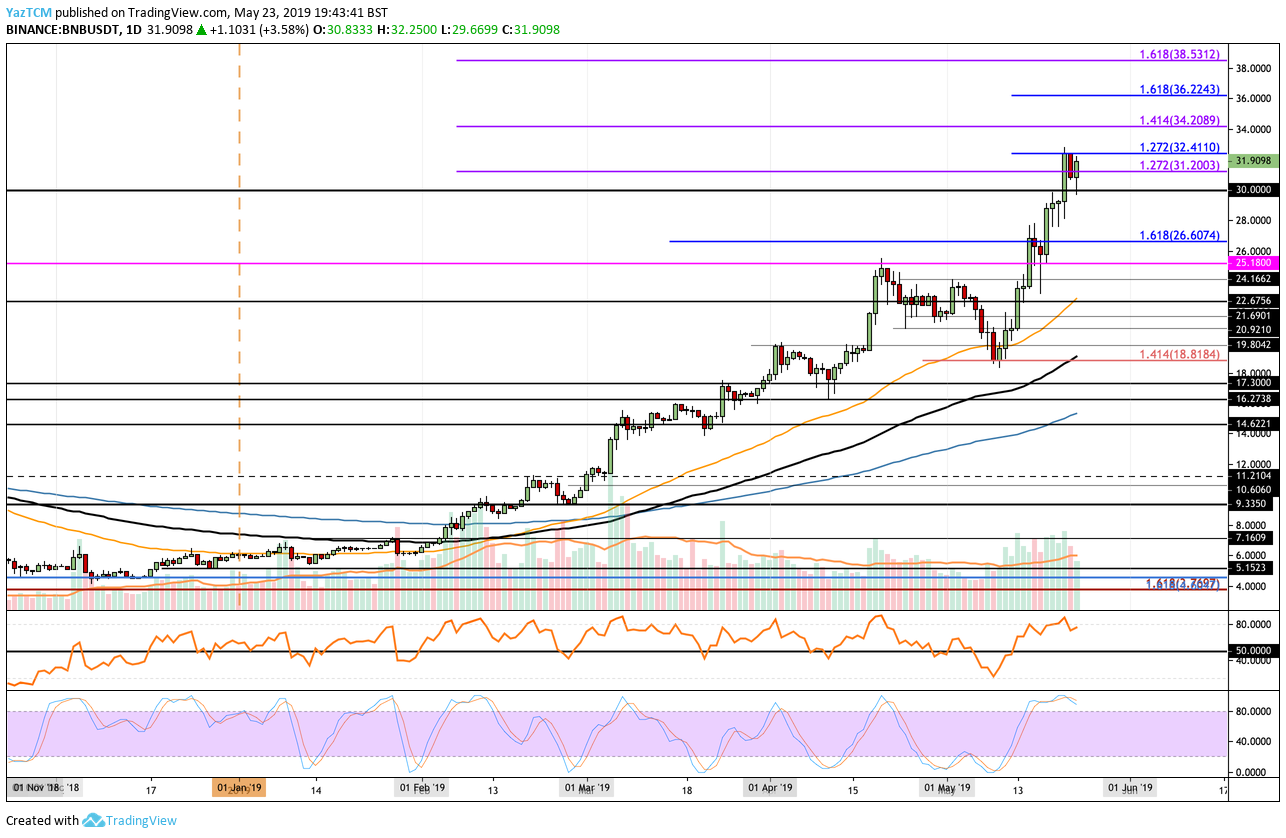
Taking a look at the BNB/USD chart above, we can see that Binance Coin recently created a fresh, new all-time high price at $32.80 on May 21, 2019, making it the only coin in the top 50 projects to break its previous ATH.
We can see that Binance Coin is now attempting to break further above the previous ATH level after the recent price increase seen today
What Is the Current Trend?
The current trend for Binance Coin is most certainly bullish. For this bullish trend to be invalidated, we would need to see Binance Coin fall and break beneath the $25.18 level.
Where Can We Go From Here?
If the bullish pressure continues to push Binance Coin further higher, we can expect immediate resistance above to be located at the short-term 1.272 Fibonacci Extension level (drawn in blue), priced at $32.41. Above this, further resistance is then to be expected at the medium-termed 1.414 Fibonacci Extension level (drawn in purple), priced at $34.20.
If the bulls can continue to drive the market further above the resistance at $35, we can expect higher resistance above to then be located at the short-term 1.618 Fibonacci Extension level (drawn in blue), priced at $36.22. This is then followed up with more resistance at the medium-term 1.618 Fibonacci Extension level (drawn in purple), priced at $38.53.
What Are the Technical Indicators Showing?
The technical indicators are currently warning traders to be cautious moving forward, as they suggest that the market may be a little overextended. The Stochastic RSI is trading in overbought conditions and is primed to deliver a bearish crossover signal in overbought territory which is a bearish signal.
This sentiment is further confirmed by the RSI as it is currently trading near overbought levels, which indicates that the buyers may soon reach exhaustion which may result in a slight pullback.
If this is the case, we can expect immediate strong support beneath the market to be located at $31.20 and $30. If the selling can continue beneath the strong support at $30, further support below is then to be expected at $28, $26.60, and $25.18.
Further below $25, lower support then lies at $24.16, $22.67, and $21.69.
Conclusion
Binance Coin has seen a wonderful price surge over the past 90 trading days, which totals over 195% and while the rest of the cryptocurrency market has taken a recent tumble, Binance Coin continues to remain unscathed.
However, the technical indicators are warning traders to remain cautious as they suggest the market may be a little too stretched moving forward.

