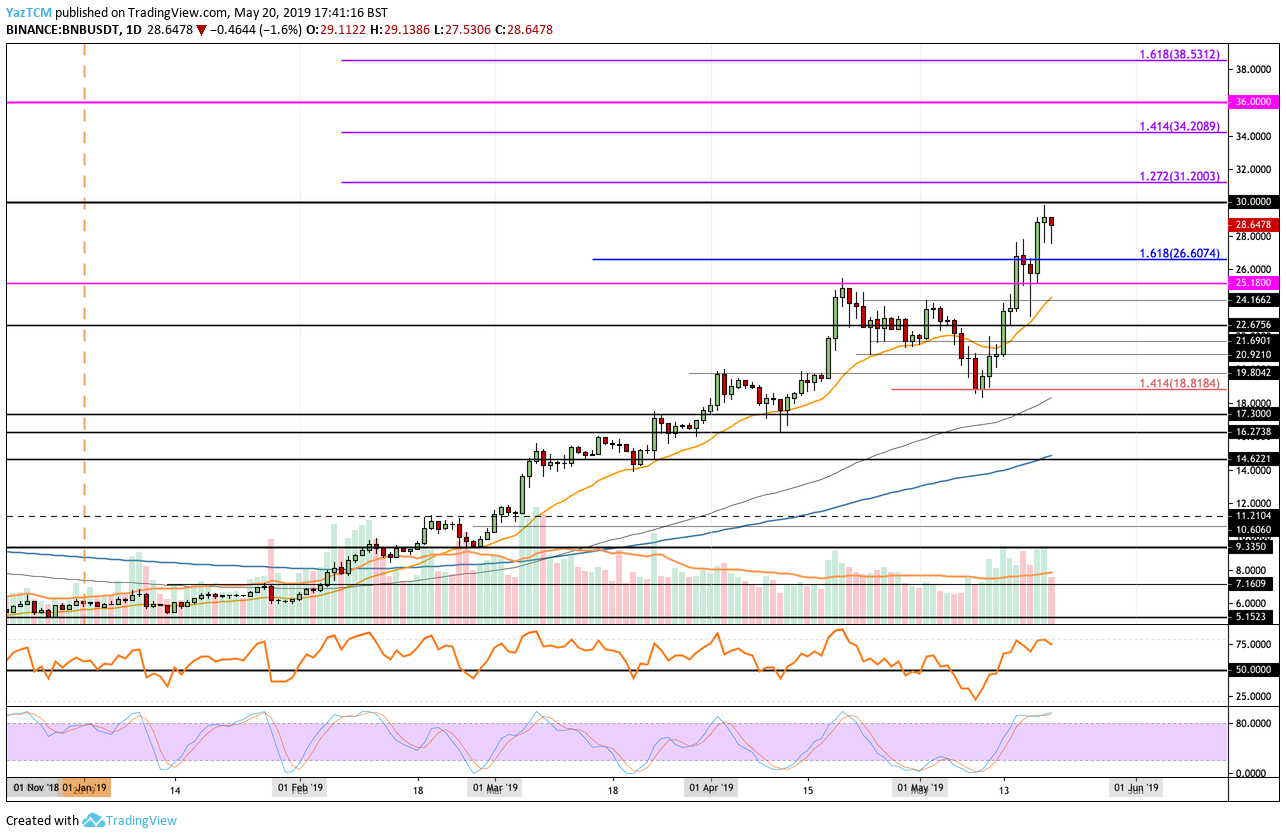
Binance Coin continues to be the strongest performer in the top 10 ranked cryptocurrencies after surging by a further 64% in May 2019 alone, bringing the current price for the coin up to around $28.75. The cryptocurrency has seen a 22% price increase in the last 7 trading days, which has allowed BNB to create a fresh all-time high (ATH) at $29.83, making it the first coin in the top 50 projects to break its previous ATH.
Binance Coin is currently ranked in 7th position in the market cap rankings, as it presently holds a $4.06 billion market cap valuation.

In this article, we will take a look at the next target levels above $30 for Binance Coin. If Binance Coin breaks the $30 level, we can expect it to travel further higher toward the $38 level.
Let us take a look at the BNB/USD market and highlight some potential areas of support and resistance moving forward for Binance Coin.
Binance Coin Price Analysis
BNB/USD – MEDIUM TERM – DAILY CHART

What Has Been Going On?
Taking a look at the chart above we can see that Binance Coin has clearly been surging all year. In fact, over the past 90 trading days, Binance Coin has surged by a total of 226%. We can see that after rebounding at support around $18.81, during mid-May BNB/USD continued to climb further higher, breaking its previous ATH at $25.18.
Binance Coin then continued to climb further higher, breaking above resistance at $26.60 and $28, to reach a high of $29.83 before rolling over and falling again.
What Is the Current Trend?
The current trend for Binance Coin is most certainly bullish. For this bullish trend to be invalidated, we would need to see BNB/USD fall and break beneath the $18.00 support level.
Where Are the Next Targets Above $30?
If the bulls can make another attempt at $30 and break above, we can expect the first initial target above to be located at the medium-termed 1.272 Fibonacci Extension level (drawn in purple), priced at $31.20. Above this, further resistance then lies at $32, $33, and then at the 1.414 Fibonacci Extension level (drawn in purple), priced at $34.20.
If the bullish pressure continues to climb above $35, we can then expect more resistance at the $36 level. Above $36, the next target is then located at the 1.618 Fibonacci Extension level (drawn in purple), priced at $38.53.
What If the Sellers Regain Control?
Alternatively, if the sellers regroup and begin to push the BNB/USD market lower, we can expect immediate support toward the downside to be located at $28 and $26. If the selling continues beneath $26 we can expect further support to then be located at $25.18, $24.16, $22.67 and $20.92.
If the selling continues beneath $20, we can expect further support below to be located at $19.80 and $18.81.
What Are the Technical Indicators Showing?
The Stochastic RSI is showing the market may be slightly overstretched at this moment and may need to retrace slightly to allow the bulls some room to rest before being able to attempt a climb higher. This is further confirmed by the RSI, as it also trades in overbought territory which suggests that the bulls are a little overextended.
Conclusion
Binance Coin has most certainly been the strongest-performing top coin this year so far, after increasing by a total of 380% from the 2019 open. If the buyers can cause Binance Coin to rise above the $30 resistance level, we can expect the first target above $30 to be located at $31.20. Above $31.20 the next significant target is to be expected at $34.20 and then at $36.
The technical indicators are suggesting that a small retracement may occur over the next few days which could see BNB/USD fall slightly into support around the $25-$22 region.

