Cardano has seen an impressive 70% price increase over the past 90 trading days that has allowed the price for the token, ADA, to reach its current price at around $0.065. Despite the large price hikes from 3 months ago, the coin has seen a 5.45% price fall over the past 7 trading days and a further 30% price plummet over the past 30 trading days.
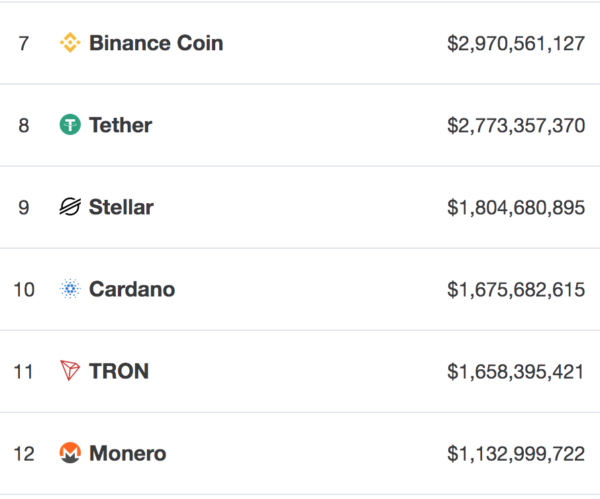
Cardano is presently ranked in 10th position amongst the top cryptocurrencies by market cap value, as it currently holds a $1.67 billion market cap valuation.

In this article, we will take a look at Cardano’s potential to reach the $0.075 level by the end of the week. Although the market may have been dropping over the past 30 days, the market has reached a level of strong support, provided by a 100-day moving average level, that could provide a solid springboard to allow ADA/USD to rebound slightly.
For ADA/USD to hit the target of $0.075 by the end of the week, the cryptocurrency will need to increase by a total of 15%. It is important to mention that, against Bitcoin, Cardano has also been suffering pretty brutally. Cardano has dropped from a high of around 1,940 SATS in April 2019 to where it is currently trading at the 1,091 SATS level. However, the 1,000 SATS level should also provide strong support for ADA/BTC moving forward.
Cardano Price Analysis
ADA/USD – MEDIUM TERM – DAILY CHART

What Has Been Going On?
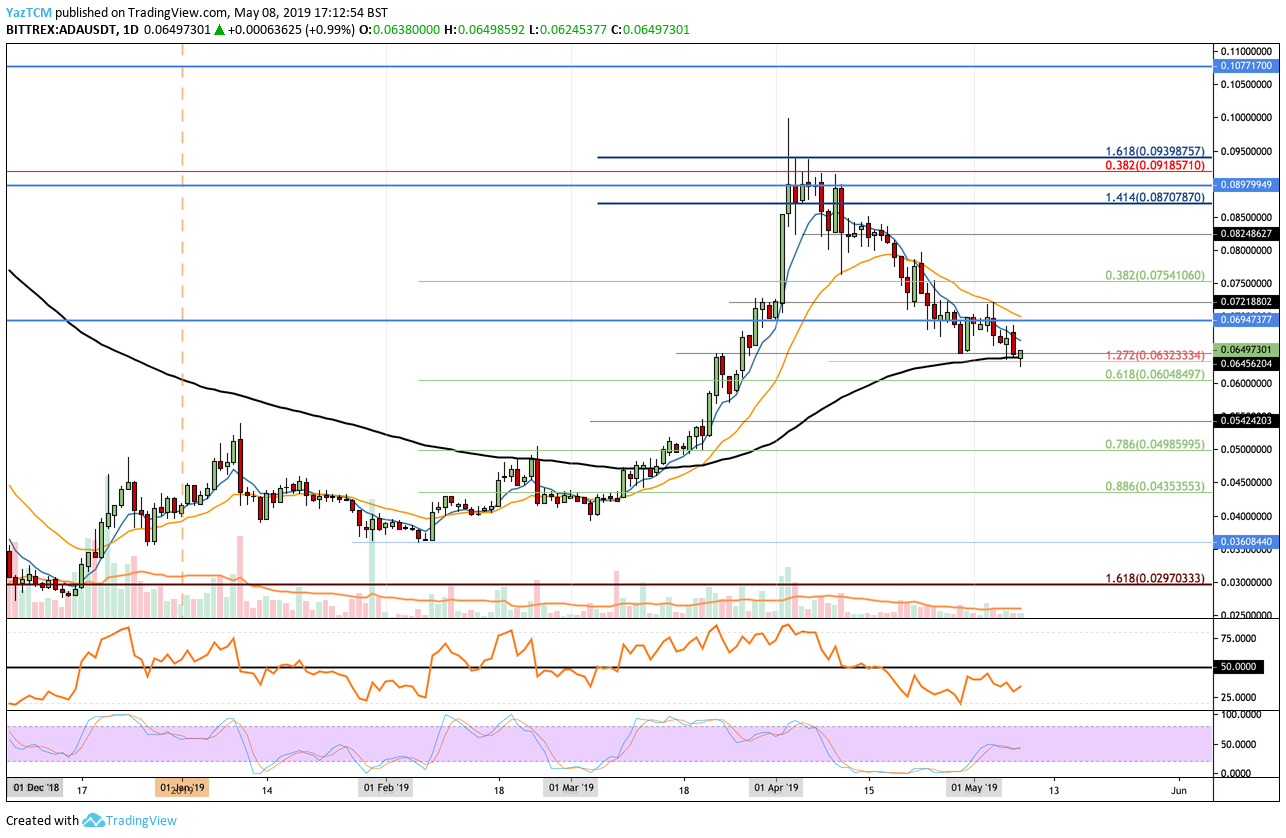
Taking a look at the ADA/USD chart above, we can see that during April 2019, the market managed to surge higher into resistance at the $0.09398 level before rolling over. After meeting this resistance, the market reversed and began to drop aggressively throughout the month. Since setting the high, the market has fallen by a total of 32% to the current price.
However, we can see that the Cardano market has now reached support at the 100-day moving average level around $0.06390. This level of support is bolstered further by a short-term downside at the 1.272 Fibonacci Extension level.
What Is the Current Short-Term Trend?
The current short-term trend for ADA/USD is bearish. For the market to turn bullish, we would need to see ADA/USD rise and climb above the $0.08 level.
Where Can We Go From Here?
If the bulls can hold the market at the support provided by the 100-day moving average we can expect ADA/USD to rise over the next few days. If this is the case, we can expect immediate resistance above to be located at the $0.070 level. This level had provided strong support for the market during October 2018 and also contains the 21-day EMA and therefore will require a significant level of volume to overcome.
Above $0.070, we can expect a higher level of resistance to be located at $0.072. If the bulls can break above $0.072, they will be free to make an attempt at the target resistance level of $0.075.
If the buyers continue further above $0.075, we can expect higher resistance to be located at $0.080 and $0.082.
What If the Bears Regain Control?
Alternatively, if the sellers continue to push ADA/USD beneath the support at the 100-day moving average, we can expect immediate support beneath to be located at the short-term .618 Fibonacci Extension level (drawn in green), priced at $0.060. Beneath $0.060, further support is then to be expected at $0.055, $0.052, and $0.050, which also is bolstered by the .786 Fibonacci Retracement level (drawn in green).
What Are the Technical Indicators Showing?
The RSI is currently beneath the 50 level, which indicates that the bears are still in control of the market momentum. If we would like to see some form of recovery toward $0.075, we would need to see the RSI start to rise toward 50 to indicate the sellers are running out of momentum and steam.
Conclusion
It will be a difficult task for Cardano to be able to hit $0.075 by the end of the week. However, if the bulls can hold the support at the 100-day moving level, there is potential that Cardano may be able to rebound and hit the target level by the end of the week.

