- Cardano has released an academic paper on the construct of the PoS algorithm.
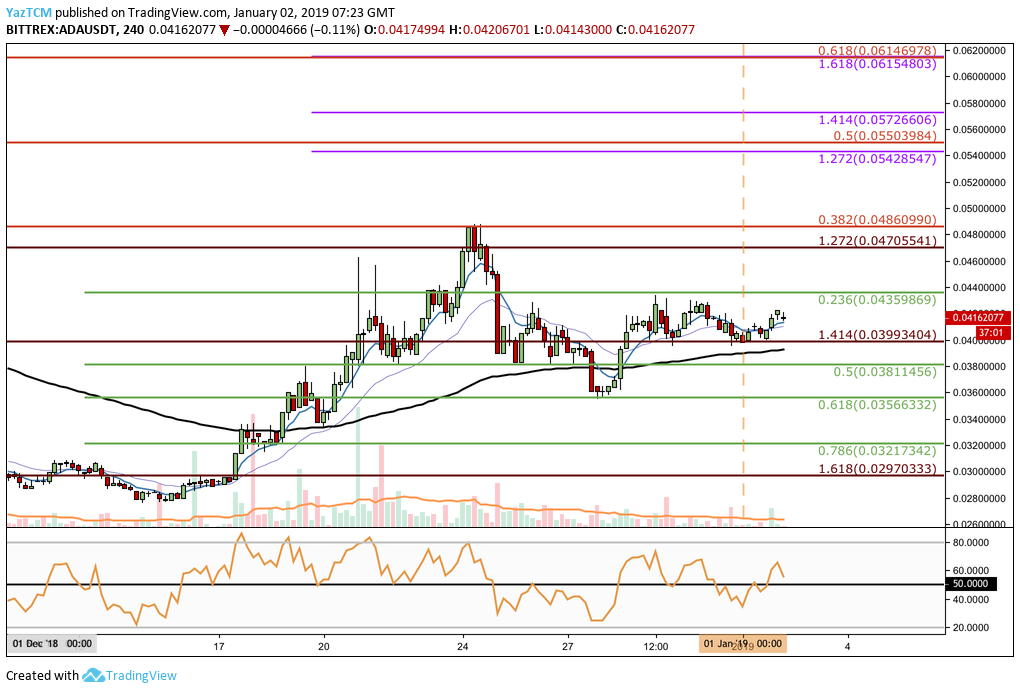
- The market is now trapped within a narrow trading range between $0.04359 and $0.03993.
- Support moving forward: $0.03993, $0.03811, $0.03566, $0.03217, $0.02970, $0.028.
- Resistance moving forward: $0.04359, $0.04705, $0.04860, $0.050, $0.05428, $0.05503, $0.05726, $0.06154.
Latest Cardano News
Cardano capped off 2018 with their latest update, version 1.4, which has been said to be the most significant update to the Cardano ecosystem.
The version 1.4 update provides considerable performance and functionality improvements to the Cardano blockchain. It also allows users to store data in a more efficient manner, thereby saving hard drive space.
Following that update, the Cardano team released their official Proof-of-Stake whitepaper on December 23, 2018.
The whitepaper goes over the Proof-of-Stake algorithm and provides an in-depth review which proves its concept in an academic manner, something which has never been done before. With the launch of this whitepaper, the PoS algorithm now has a provable construct which developers can now reference.
The whitepaper also provides rigorous definitions on the PoS system, which have also never been provided.
The whitepaper focuses on the use of sidechains within the PoS system. Sidechains have been a core component for blockchain scalability and interoperability but a peer-reviewed study had never been conducted.
The PoS whitepaper covers definitions on sidechains, which they have dubbed “pegged ledgers,” implementation of the pegged ledgers along with maintenance notes, and detailed procedures on withdrawing funds from the sidechains to the main chain securely.
The whitepaper also covers the all important security aspect of the pegged ledgers.
The release of the whitepaper now brings the PoS algorithm to an academic level, and will likely have a profound effect on all cryptocurrencies that use, or intend to use, the algorithm.
In other Cardano news, Trezor integration has officially been announced for Cardano, giving users a secure hardware wallet option to store coins safely.
Let us continue to take a look at the ADA/USD market and provide any potential areas of support and resistance moving forward.
ADA Price Analysis
Cardano has seen a small price increase totaling 2.55% over the past 24 hours of trading, bringing the current trading price to $0.04162, at the time of writing. The cryptocurrency has now seen a 1% increase over the past 7 trading days, with a further 3.55% price increase over the past 30 trading days.
Cardano is ranked in 11th position with a total market cap value of $1.09 billion. The academic, peer-reviewed blockchain project has undergone a 48% price fall over the past 90 trading days. The 15-month old cryptocurrency now trades at a price that is 96% lower than its all-time high value.
Taking a look at the ADA/USD market from the 4-hour time frame above, we can see that ADA had slipped slightly below our expected support at the long-term downside 1.618 Fibonacci Extension level (drawn in dark red) priced at $0.029, but had found support around the $0.028 handle.
After reaching this level of support, price action rebounded and began to rise throughout the second half of December 2018.
The short-term bullish run drove price action for ADA/USD into resistance provided by the bearish .382 Fibonacci Retracement level (drawn in red) priced at $0.04860 before the market rolled over. This Fibonacci Retracement is measured from the high seen in November 2018 to the low seen during December 2018.
After rolling over, the market began to retrace until finding support at the short-term .618 Fibonacci Retracement level (drawn in green) priced at $0.03566.
Price action bounced again at this support to where it is currently trading, trapped within a short-term range with support provided by the previous downside 1.414 FIbonacci Extension level (drawn in dark red) priced at $0.039934 and resistance provided by the short-term .236 Fibonacci Retracement level (drawn in green) priced at $0.04359.
Trend: Bullish Above $0.04860
The market is now trapped within a short-term range, as mentioned above.
The long-term bearish trend has now seemed to have ceased. For the ADA/USD market to be considered bullish, we would need to see the market create a fresh high, breaking above $0.04860.
Where is the Resistance for ADA Located Above the Trading Range?
If the bulls can cause price action to break above the upper boundary of the trading range at $0.04359, then we can expect further higher resistance to be located at the bearish .382 Fibonacci Retracement level (drawn in red) priced at $0.04860.
If the bulls can continue to break higher and penetrate above the $0.050 handle, higher resistance can be located at the short-term 1.272 Fibonacci Extension level (drawn in purple) priced at $0.05428. This is followed by the bearish .5 Fibonacci Retracement level (drawn in red) priced at $0.05503.
Higher resistance above $0.055 can then be located at the 1.414 and 1.618 Fibonacci Extension levels (drawn in purple), priced at $0.05726 and $0.06154 respectively.
Where is the Support for ADA Located Below the Trading Range?
If the sellers can force price action to break below the lower boundary of the trading range at $0.03993, we can expect further support below to be located at the short-term .5 and .618 Fibonacci Retracement levels (drawn in green), priced at $0.03811 and $0.03566 respectively.
If the market heads further lower, more support toward the downside can be found at the short-term .786 Fibonacci Retracement level (drawn in green) priced at $0.03217. This is followed by the previous downside 1.618 Fibonacci Extension level (drawn in dark red) priced at $0.02970.
Conclusion
The Cardano team has made a major breakthrough in the release of their latest academic paper. This will not only benefit the Cardano blockchain but will also likely have positive effects on the entire PoS ecosystem as a whole.


