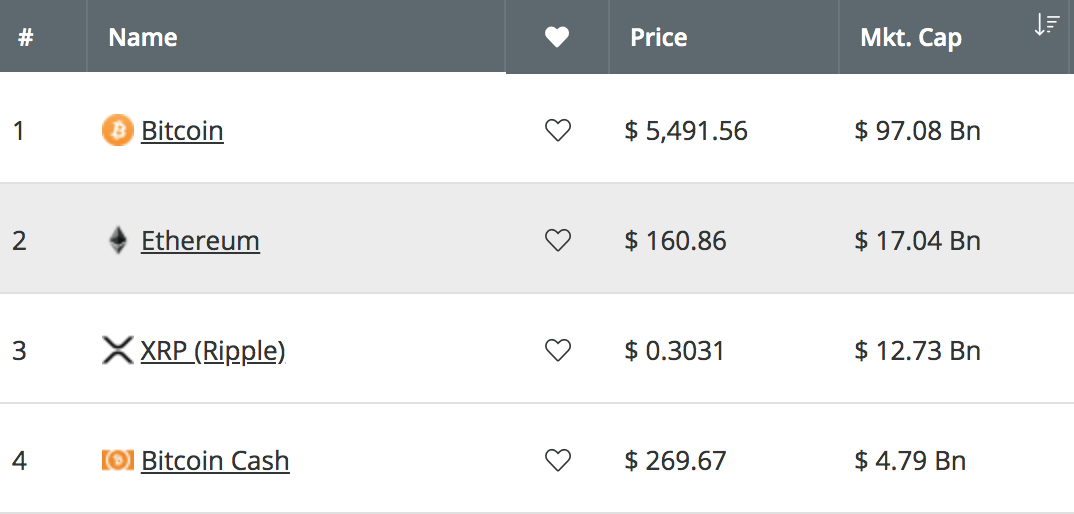
Ethereum has seen a very good 90-day period where price action has increased by a total of 49%. The cryptocurrency is currently trading at a price of around $160 after seeing some rather sluggish gains over the past 30 days, totaling just 2.14%. The 45-month-old cryptocurrency is presently ranked in 3rd position in the market cap rankings, as it holds a $17.00 billion market cap valuation.

Despite the slow positive price movement, Ethereum is still up by a total of 17% from its April 1, 2019 price low. The cryptocurrency is sitting in a comfortable position ahead of Ripple in 3rd place, which holds a $12.73 billion market cap value.
In this article, we will take a look at the potential for Ethereum to rise by 24% in May 2019, and hit the $208 target level by the end of the month. This price target contains a significant level of resistance, but should be achievable to be reached within the month of May. During April, Ethereum struggled to overcome resistance at $185, so this will be an important level to break above in the next run moving forward.
Let us take a look at the ETH/USD market and highlight some areas of resistance for the bulls before being able to reach the $208 level.
Ethereum Price Analysis
ETH/USD – SHORT TERM – DAILY CHART

What Has Been Going On?
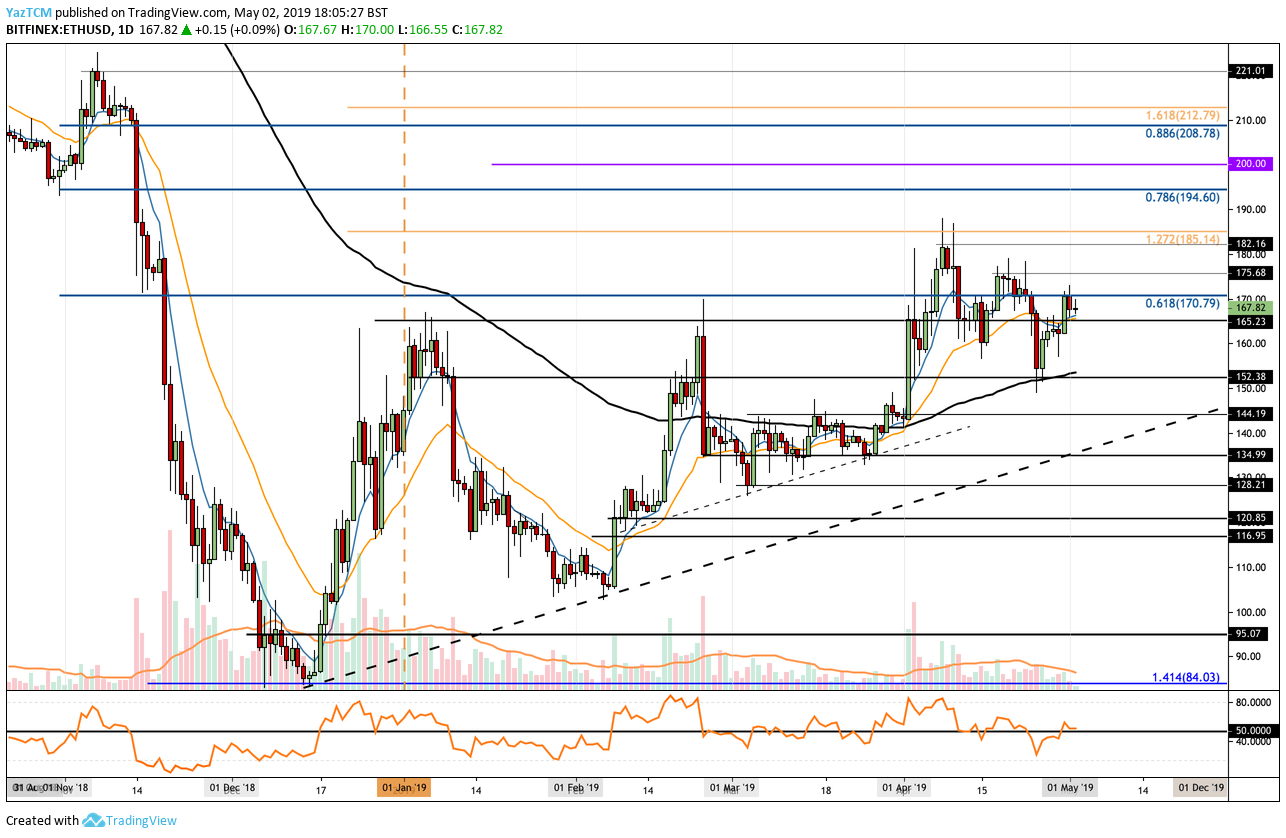
Ethereum had seen a great start to the month of April 2019 after the cryptocurrency surged by a total of 33% from a low of $141 to a high of $187. However, the coin met resistance at a medium-termed 1.272 Fibonacci Extension level (drawn in yellow), priced at $185 and proceeded to roll over and fall.
We can see that the market then went on to fall into support below at the 100-day moving average level around the $152 price range. The market has since rebounded from this support and is presently trying to tackle the $170 resistance level.
What Is the Short-Term Trend For ETH/USD?
Ethereum is currently trapped within a neutral trading trend at this moment in time. If ETH/USD can continue to climb above the $185 resistance level, we can consider the market as bullish.
If price action drops beneath the support at the 100-day moving average level, we could consider the short-term trend to be bearish.
Where Is the Resistance On the Way Up To $208?
If the bulls can proceed to push ETH/USD above the resistance at $170, we can expect immediate higher resistance to be located at $175, $182, and $185, which contains the medium-termed 1.272 Fibonacci Extension level. Above $185, further resistance is expected at the long-term bearish .786 Fibonacci Retracement level (drawn in blue), priced at $194.60.
This long-term bearish FIbonacci Retracement level is measured from the November 2018 high above $220, to the December 2018 low. Immediate resistance above $194 is then to be expected at $200.
If the buyers then break above $200, they will be free to tackle the resistance at the target price of $208. The resistance in this area is provided by the bearish .886 Fibonacci Retracement level (drawn in blue). If the bullish pressure can cause ETH/USD to break above the target price, we can expect more resistance above to be located at $212 and $221.
What Are the Technical Indicators Showing?
The RSI has recently broken back up above the 50 level, which indicates that the previous bearish pressure has started to show signs of weakness. If the buyers can continue to increase their presence and push the RSI higher, we can expect Ethereum to break above $200 in the next bullish swing higher.
Conclusion
The recent bounce at the 100-day moving average level combined with the RSI breaking above the 50 level has provided some signals that Ethereum may be preparing to move further higher during May 2019. If the buyers can break above $170, they should be free to make a run toward the $200 level. However, if the sellers do step in, there should be strong support at the 100-day moving average level around $152.

