Ethereum may have seen a small price fall around toward the $260 area over the past 24 hours, but the cryptocurrency is still up by an impressive 60.70% over the past 30 trading days. The recent bullish press from Ethereum now has the cryptocurrency primed to surge beyond $300 and possibly hit $350 by the end of June 2019.

Source: CoinCheckup
Ethereum currently holds a $27.86 billion market cap valuation, which puts it comfortably in 2nd place after seeing a 90% price explosion over the past 3 months.
To reach the target level at $350, Ethereum will need to overcome the resistance at $300 and increase by a total of 35% from today’s price. Considering Ethereum has risen by 60% in the past 30 days alone, reaching $350 seems like a very achievable task.
Let us continue to take a look at the ETH/USD market and highlight some potential areas of support and resistance moving forward.
Ethereum Price Analysis
ETH/USD – MEDIUM TERM – DAILY CHART

What Has Been Going On?
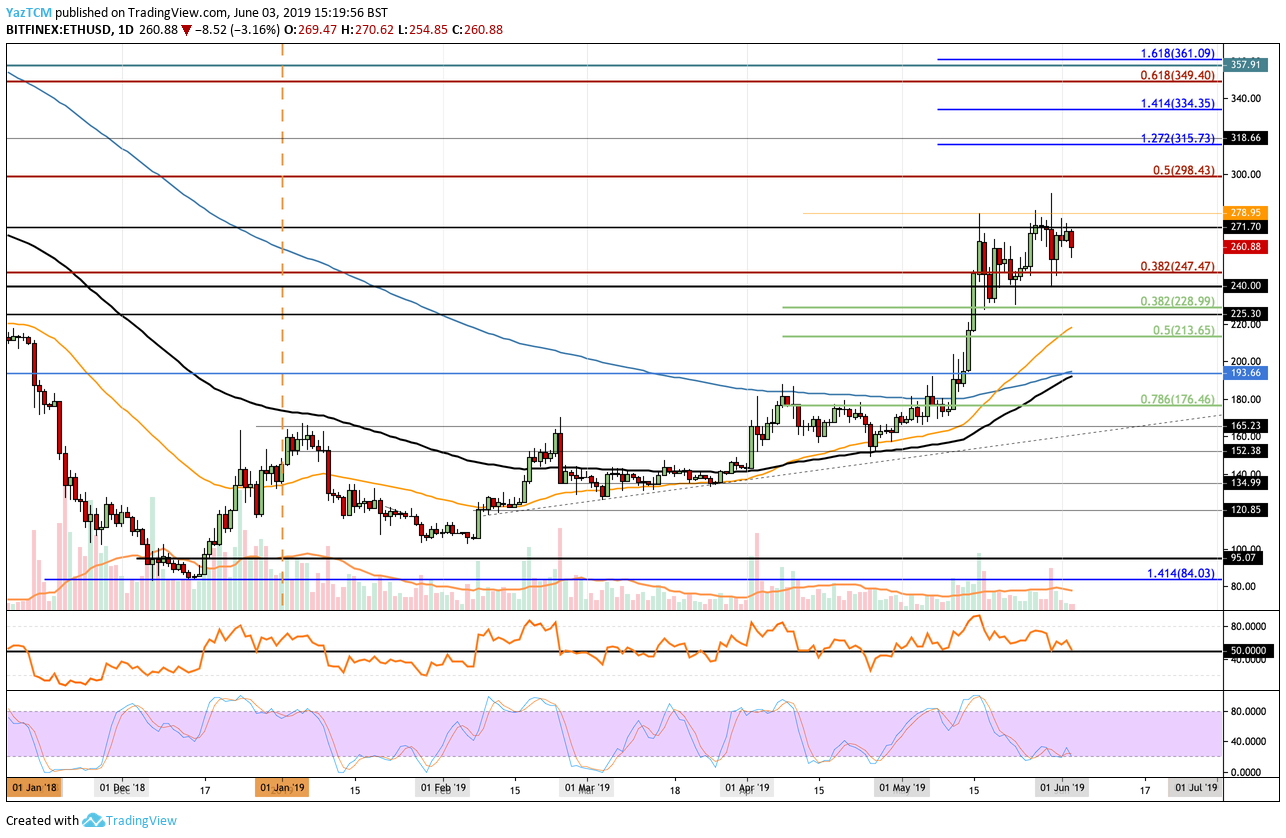
Taking a look at the ETH/USD daily chart above, we can see that Ethereum struggled to break above the resistance around the $275 level during May 2019. The market had attempted to break above during the first few days of June, but was unsuccessful and turned away toward the $260 level.
The current trading condition still remains bullish until Ethereum breaks beneath the support around the $228 level. If Ethereum was to break beneath $193, we could consider the market as bearish.
Where Is the Resistance Toward $350?
If the buyers can regroup and start to push the market back higher, we can expect immediate resistance above to be located at the $271 and $278 levels. If the bulls can continue above the May 2019 resistance, further higher resistance above is then to be expected at the bearish .5 Fibonacci Retracement level (drawn in red) priced at $298. This long-term bearish Fibonacci Retracement level is measured from the July 2018 high to the December 2018 low.
If the buyers can continue to breach the resistance at $300, we can expect further resistance above to be located at the short-term 1.272 and 1.414 Fibonacci Extension levels (drawn in blue), priced at $315 and $334, respectively. This is followed with more resistance at the bearish .618 Fibonacci Retracement level (drawn in red), priced at $349. If the bulls can clear this level, they will be free to attempt the $350 target level.
Where Is the Support Beneath the Market?
Support beneath the market is now located at $250, $247, $240, $228, $213, $200, and $193.
Conclusion
Ethereum most certainly has the potential to rise by 35% and reach the $350 target level before the end of June. Ethereum must tackle strong resistance above at $300 and $334 before being free to attempt the $350 level.

