IOTA has exploded beyond the $0.50 level, rising by a total of 37% over the past 7 trading days to reach its current trading price at around $0.5218. The cryptocurrency has now seen an impressive 98% price rise over the past 90 trading days.

Source: CoinCheckup
Currently, the IOTA market is battling with resistance between the $0.53-$0.55 level, but if the market can break above this, we could see IOTA/USD heading toward $0.60 and, possibly, much further beyond.
IOTA is now ranked in the 15th position amongst the top cryptocurrency projects by market cap valuation. It currently holds a $1.45 billion market cap value, sitting a small $80 million behind 14th position holder, Dash.
Let us continue to take a look at the IOTA/USD market and highlight some potential areas of support and resistance moving forward.
IOTA Price Analysis
IOTA/USD – MEDIUM TERM – DAILY CHART

What Has Been Going On?
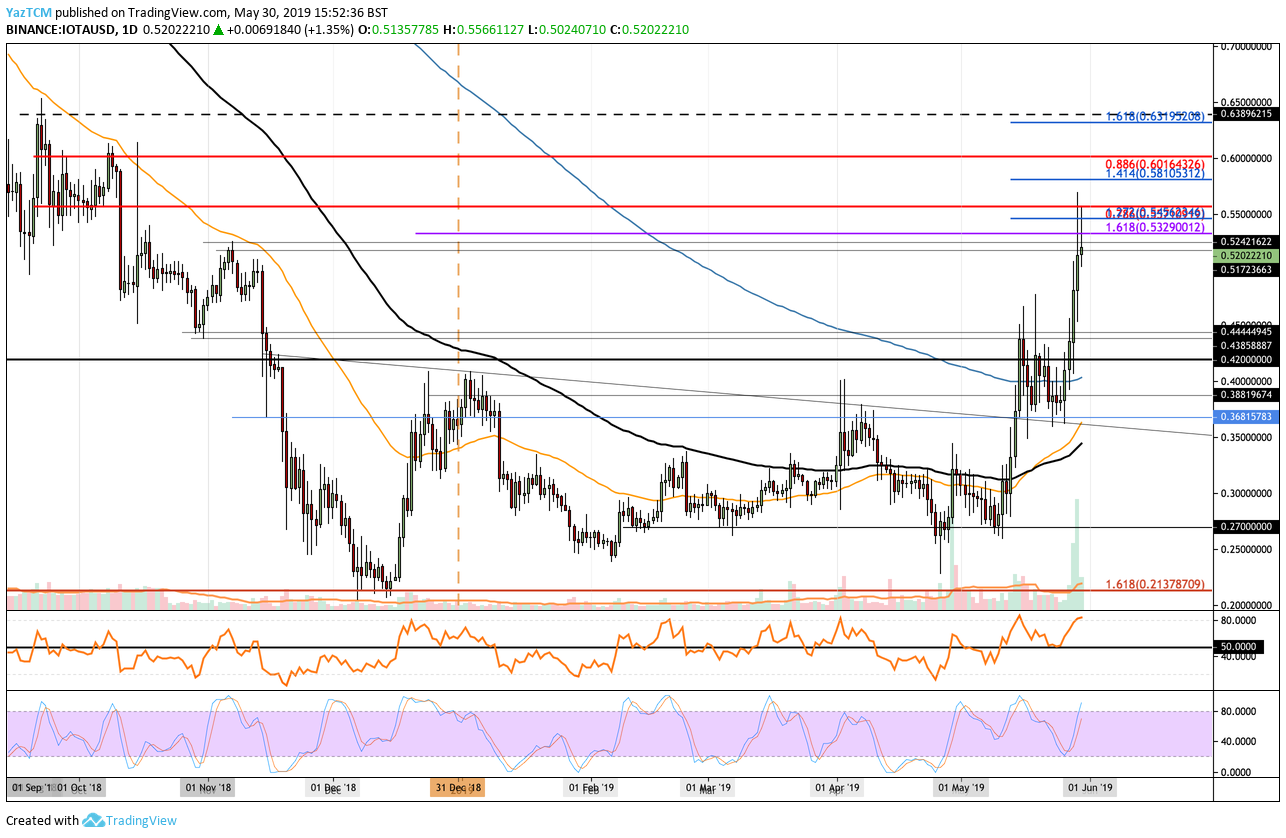
Analyzing the IOTA/USD daily chart above, we can see that the market recently surged from support at the 200-day moving average level (drawn in blue) and continued to climb above the resistance at $0.44 to create a fresh 2019 high. The market continued to rise at an extremely parabolic pace until meeting higher resistance at the long-term bearish .786 Fibonacci Retracement level (drawn in red) at $0.5501. This bearish Fibonacci Retracement level is measured from September 2018 high to the December 2018 low.
Price action has since fallen from this area of resistance and is now currently trading at around $0.52.
What Is the Current Trend?
The current trend for the market remains bullish in the short and long term. For this bullish trend to become invalidated, we would need to see IOTA fall and drop beneath the support at $0.40, at which point the market would then be considered as bearish.
Where Is the Resistance Above the Market?
If the buying can continue beyond $0.55, further higher resistance above is then located at the short-term 1.414 Fibonacci Extension level (drawn in blue), priced at $0.5810. This is then followed up with higher resistance at the bearish .886 Fibonacci Retracement level (drawn in red), priced at $0.6016.
If the bulls can cause IOTA to drive further above $0.60, further higher resistance is then to be expected at the short-term 1.618 Fibonacci Extension level (drawn in blue), priced at $0.6320. Above this, the next level of significant resistance is then to be expected at the $0.65 level.
Where Is the Support Beneath the Market?
Alternatively, if the sellers regroup and begin to push the market lower, we can expect immediate support toward the downside to be located at the $0.52, $0.51, and $0.50 levels. If the selling continues beneath $0.50, further support below is then located at $0.48, $0.46, and $0.444.
Beneath $0.444, further support is located at $0.4385, $0.42, and $0.40 (which also contains the 200-day EMA).
What Are the Technical Indicators Showing?
The Stochastic RSI had recently delivered a bullish crossover signal which had resulted in the parabolic move higher. However, the Stochastic RSI is now suggesting that the market may be a little overstretched at this time, which could result in a slight retracement moving forward.
Furthermore, the RSI itself has recently reached overbought trading conditions, which indicates that the market may need to pull back slightly to give the buyers time to breathe before continuing higher.
Conclusion
If IOTA can break above the current serious resistance around $0.55, the next levels look even juicier. A break above $0.55 could result in a further 25% price increase for IOTA to reach the $0.65 level.
However, the market has recently moved aggressively higher in a short period of time, and the technical indicators are suggesting that the market may pull back slightly over the next few days before resuming the bullish trend higher.

