Ripple has finally seen some positive price action over the past 24 hours of trading after the cryptocurrency was able to increase by 6% and reach the current price of around $0.3240. Furthermore, Ripple has now seen close to a 9% price increase over the past 7 trading days as the cryptocurrency starts to rise up out of its trading slump.
However, Ripple is still strongly underperforming against Bitcoin and Ethereum.

This case of underperformance is largely due to the fact that Ripple has been dropping heavily over the past few weeks against Bitcoin itself. However, this all may be about to change, as XRP/BTC recently met support at the 4,120 SAT level, which provided strong support for the market during September 2018 and therefore is expected to provide a strong level of support moving forward.
If XRP/BTC can hold at this support and start to reverse, and Bitcoin continues to increase in price, this may be one of the last moments for investors to be able to purchase XRP in the low $0.30s range. Once XRP/USD breaks above the 100-day moving average and clears the $0.35 level, it likely won’t return to these prices for a long time.
Ripple Price Analysis
XRP/USD – MEDIUM TERM – DAILY CHART

What Has Been Going On?
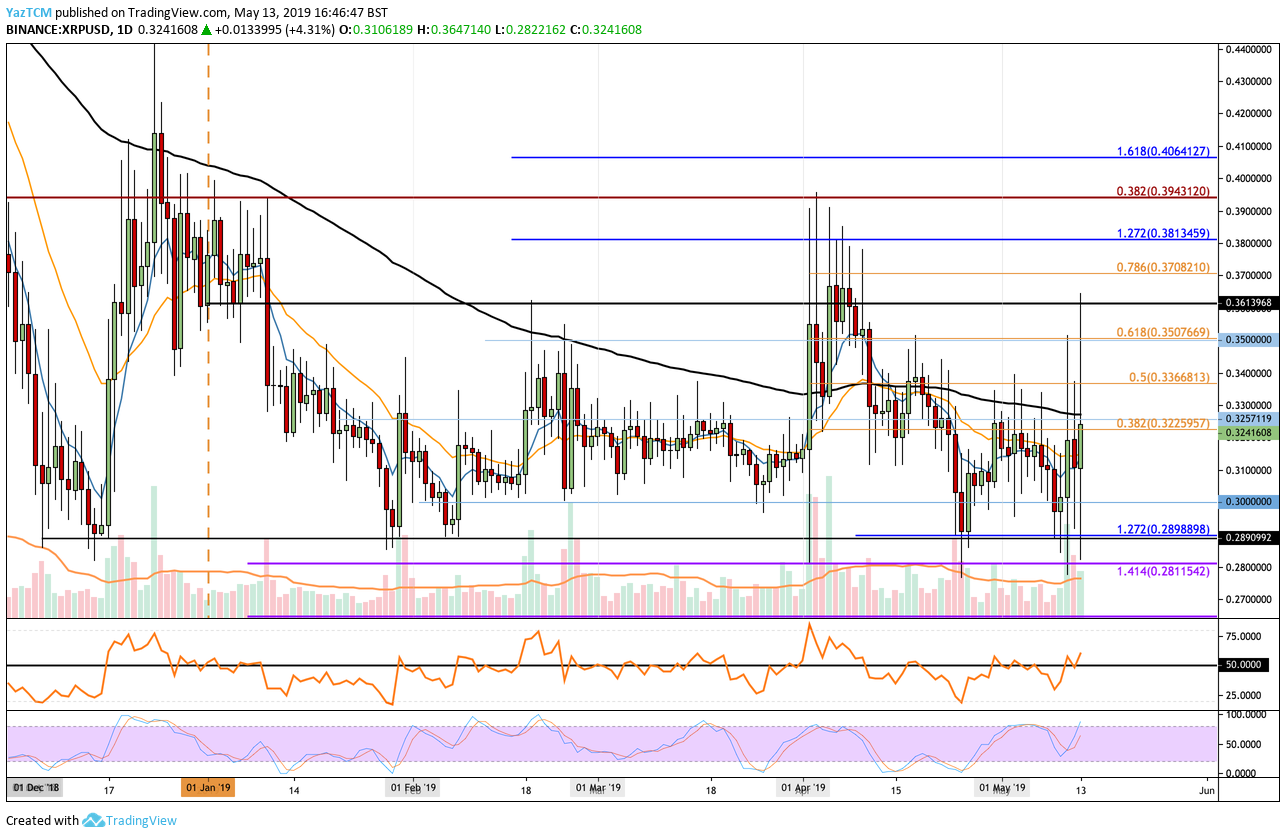
Taking a look at the XRP/USD market above on the daily chart, we can see that XRP has largely been trading within a sideways trading range between $0.29 and $0.37 for the past 3 or so months.
The cryptocurrency has found a strong level of support at the $0.2898 level and has managed to remain above this level through the entire year. However, Ripple has been struggling to make any movement above resistance around the 100-day moving average level, which currently hovers around the $0.33 level. If XRP/USD can break above here, it may be free to make an attempt above $0.35.
What Is the Current Short-Term Trend?
The short-term trading trend for XRP/USD is currently neutral. The cryptocurrency has been trading sideways for a long period of time, as neither the bulls nor the bears can re-establish a trend. A break above the $0.37 level would render XRP/USD bullish again, whereas a break below $0.28 would see XRP/USD resuming its bearish trend.
Where Can We Go From Here?
If the buyers can regroup and begin to push the XRP/USD market higher, we can expect immediate resistance above the market to be located at the 100-day moving average level around $0.33. If the bulls can break above $0.33 and the 100-day moving average level, we can expect higher resistance to then be located at $0.3368 and $0.35, which are the bearish .5 and .618 Fibonacci Retracement levels (drawn in orange) respectively.
If the bullish pressure can continue further above $0.35, we can then expect further resistance above to be located at $0.3610 and $0.37.
What If the Sellers Regroup?
Alternatively, if the sells group up and start to push the market lower again, we can expect immediate support toward the downside to be located at $0.32, $0.31, and $0.30. If the sellers continue beneath the $0.30 level, further support is then expected at the $0.2989 level, which contains the downside 1.272 Fibonacci Extension level. Beneath this, further support lies at $0.28.
What Are the Technical Indicators Showing?
The RSI has recently managed to break above the 50 level for the first time since early April 2019, which is a positive sign for Ripple as this indicates that the buyers have recently managed to establish control of the market momentum. If the RSI can continue to remain above 50, we can expect the buyers to break above the 100-day moving average pretty soon.
Conclusion
If Ripple can turn around at the current support around the 4,000 SAT level against Bitcoin, we can expect XRP/USD to break the 100-day moving average level and make some positive movement above $0.33. If this does happen, we can expect XRP/USD to continue further above $0.40 which would mean that this may be one of the last few moments to be able to pick up some XRP in the low $0.30s range.

