- Litecoin has recently surged, breaking above Stellar’s market cap value.
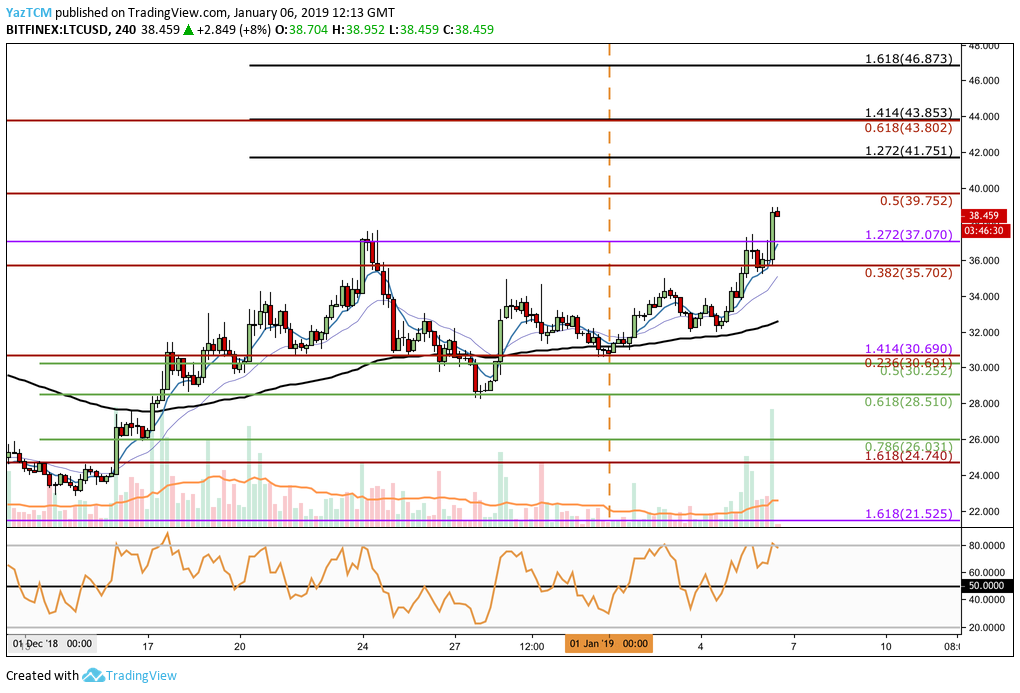
- The LTC market has broken above the previous resistance at $37 as it races toward $45.
- Support moving forward: $37.07, $35.70, $30.69, $28.51, $24.74.
- Resistance moving forward: $39.75, $41.75, $43.85, $46.87.
Latest Litecoin News
It seems that the recent marketing efforts from the Litecoin Foundation, combined with recent exchange partnerships, have helped Litecoin surge over the past few days as LTC races toward the $40 handle.
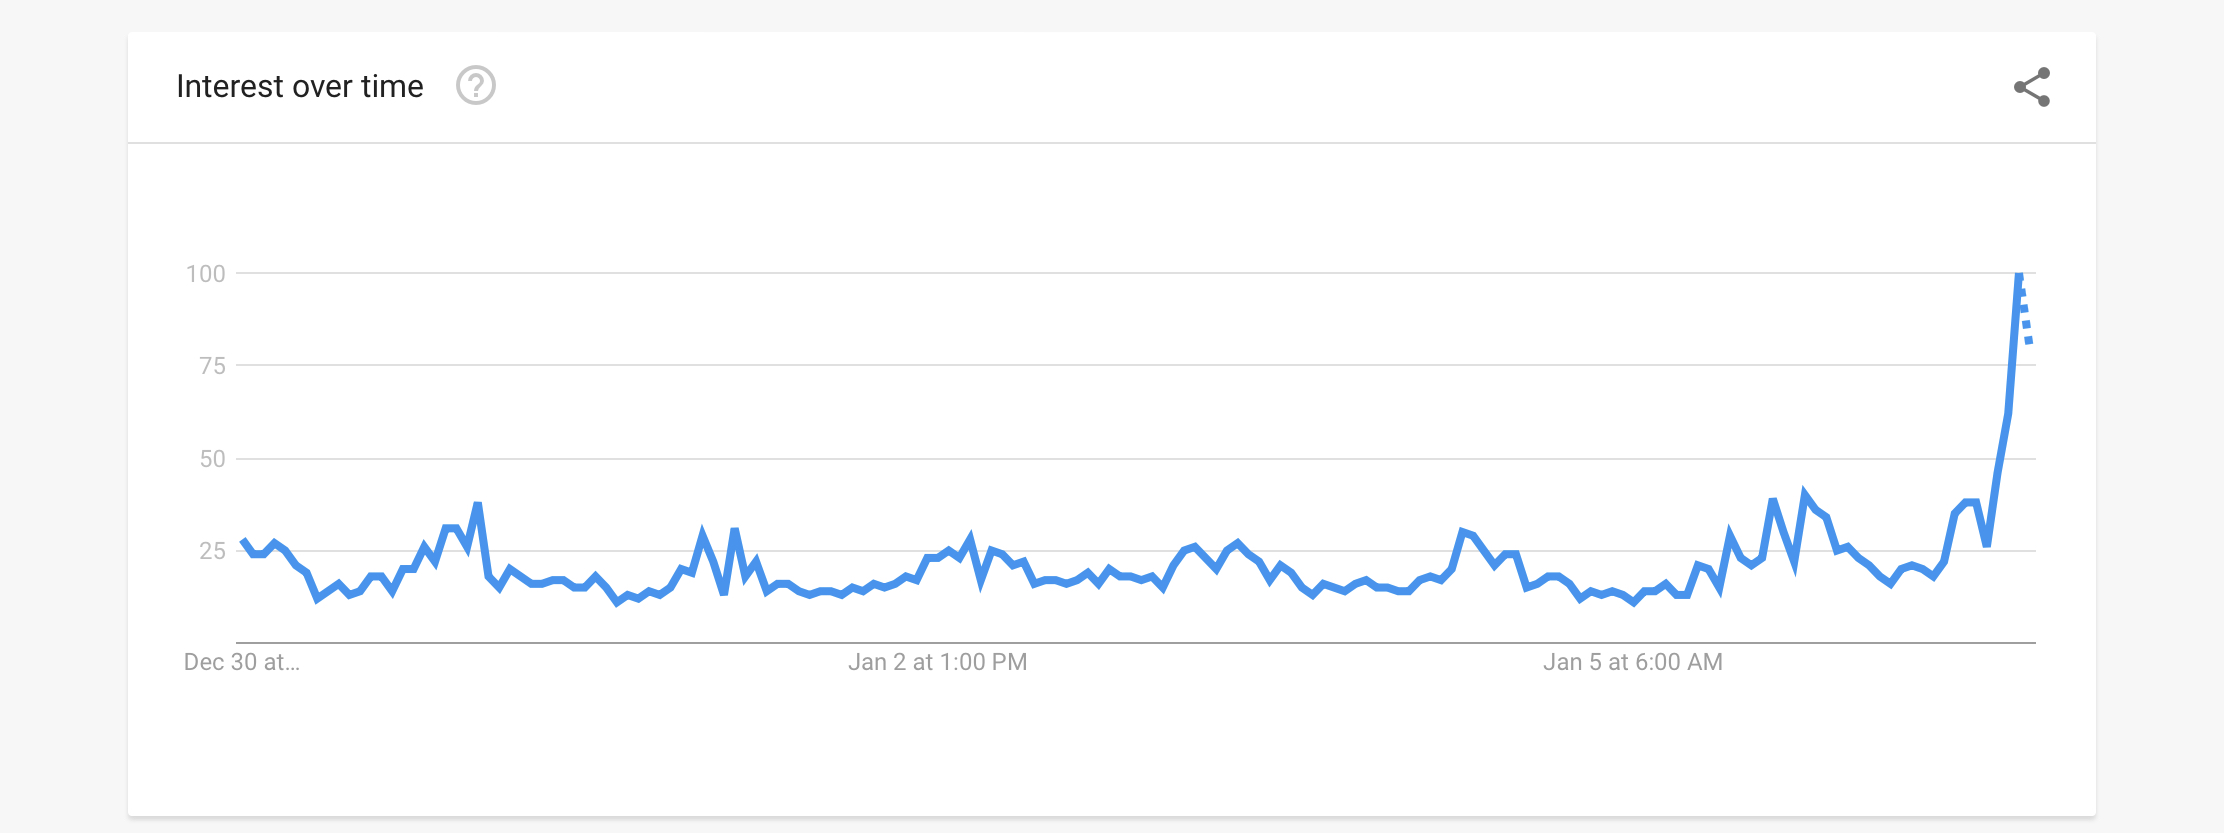
The recent rally began after the Litecoin Foundation sponsored the UFC’s 232 co-main event and received a “shoutout” from the iconic voice of the Octagon, Bruce Buffer. The event was broadcast to millions of viewers worldwide and Google Search trends during and after the event reached a peak of 100, indicating that the term “Litecoin” was at its most popular.
During the recent price rise, the search trend for Litecoin has increased much further and reached another 100 peak, rendering the previous search term peak (which will now be much less than 100) insignificant, as illustrated by the graph below.

The marketing boost from the UFC event may have had a significant role in the recent price rise but it is likely that the recent announcement of OKEx adding Litecoin-Ethereum “perpetual swaps” to their exchange was a factor as well. These perpetual swaps are virtual derivatives for traders that provide 100x leverage and have no expiration date.
In other major Litecoin news, Litecoin’s Lightning Network has recently passed 100 nodes as the brand new off-chain scaling solution continues to grow.
The Litecoin Lightning Network has just surpassed 100 Active Nodes ⚡️#Litecoin #ltc #crypto #cryptocurrency #blockchainhttps://t.co/nxRVeH61MP
— Litecoin.com (@LitecoinDotCom) January 5, 2019
Let us continue to take a look at price action for LTC/USD and highlight any potential areas of support and resistance moving forward.
LTC Price Analysis
Litecoin has seen a significant 10.96% price increase over the past 24 hours of trading, bringing the current trading price up to around $38.45, at the time of writing. The cryptocurrency has now undergone a price hike totaling 19.31% over the previous 7 trading days, with a further price surge totaling 49% over the past 30 trading days.
Litecoin has now surged into 6th position in the market cap rankings. It has overtaken Stellar today after the market cap for Litecoin rose to $2.48 billion.
The 68-month old project, however, is still trading at a value that is 89% lower than its all-time high price.
Analyzing price action from the short 4-hour perspective above, we can see that the Litecoin market began to rise from $22.84 on December 14, 2018. The market continued to rise until resistance was met at the previous long-term downside 1.272 Fibonacci Extension level (drawn in purple) priced at $37.07.
As LTC/USD reached this area of resistance, the market rolled over and began to decline until support was found below at the short-term .618 FIbonacci Retracement level (drawn in green) priced at $28.51.
After reaching this area of support, the market bounced and began to ascend once again.
Trend: Bullish
Price action has recently broken above the previous peak at $37.07, beginning a new bullish wave higher. This has put the market in a bullish trading condition, at this moment in time.
For the trend to return to a bearish condition, we would need to see price action fall and head below the $28.51 handle.
Where is the Resistance for LTC Located Towards the Upside?
If the bulls continue to drive LTC/USD higher, they will first encounter higher resistance at the bearish .5 Fibonacci Retracement level (drawn in red) priced at $39.75. This Fibonacci Retracement level is measured from the high seen during November 2018 to the low placed in December 2018.
If the buyers can cause price action to break above the $40 handle, we can expect further resistance above to be located at the short-term 1.272 and 1.414 Fibonacci Extension levels (drawn in black), priced at $41.75 and $43.85 respectively.
The resistance at $43.85 will require significant momentum to overcome as it is further bolstered by the bearish .618 Fibonacci Retracement level (drawn in red) priced at $43.80.
If the bulls continue to break above the $45 handle, more resistance can then be located at the 1.618 Fibonacci Extension level (drawn in black) priced at $46.87.
Where is the Support Located if the Bears Push Price Action Lower?
If the sellers begin to push price action lower, we can expect immediate support toward the downside to now be located at the previous downside 1.272 Fibonacci Extension level (drawn in purple), priced at $37.07.
Further support below can then be expected at the bearish .236 Fibonacci Retracement level (drawn in red) priced at $30.69. This is followed by the previous “higher low” level at the previous .618 Fibonacci Retracement level (drawn in green) priced at $28.51.
Note that the other support at the green colored Fibonacci Retracement levels are now rendered obsolete as price action has traveled further higher today.
What are the Technical Indicators Showing?
On the daily chart for LTC/USD, the RSI is trading well above the 50 handle. This indicates that the bulls are in complete control of the momentum within the market.
The RSI on the daily chart has still room to travel further higher which may indicate that LTC/USD will still be traveling higher in the days to come before the RSI approaches overbought conditions.
Conclusion
The recent marketing efforts have most certainly paid off for Litecoin as the Google Search trends reach their newly-established peaks. The excitement alone could continue to cause Litecoin to catch up to the market cap of EOS which is just $200 million away.


