Aion has seen a small 2.36% price decline over the past 24 hours of trading. The cryptocurrency is currently exchanging hands at a price of $0.43 per token after suffering a precipitous price drop totaling 24% over the past 7 trading days.
Aion has commonly been described as a 3rd generation blockchain. The 1st generation of blockchains are the cryptocurrencies spearheaded by the likes of Bitcoin, used as a means of transaction. The 2nd generation of blockchains are the cryptocurrencies that provide facilities for developers to launch decentralized applications (dapps) such as Ethereum. The 3rd generation of blockchains, of which Aion is the first, allows different blockchains to communicate with one another.
The team behind Aion understands that the blockchain space is continuously growing and evolving, but has noticed that all the blockchains have no methods of communicating with one another. The Aion cryptocurrency was launched to bridge the gap between blockchains allowing the exchange of data and value between Aion-compliant blockchains.
Aion, created by Matt Spoke, is headquartered in Toronto, Canada. The platform can also facilitate the creation of private and public blockchains which are also interoperable with all Aion-compliant blockchains.
For more information on Aion, we recommend to read our “What is Aion” guide.
Aion is currently ranked 65th in terms of overall market cap across the entire industry. It has a total market cap value of $90 million after suffering a 72% price decline of the past 90 trading days. Aion is currently down a significant 96% from its all-time high.
Let us continue to analyze price action for Aion over the long term.
Aion Price Analysis
AION/USD – LONG TERM – DAILY CHART
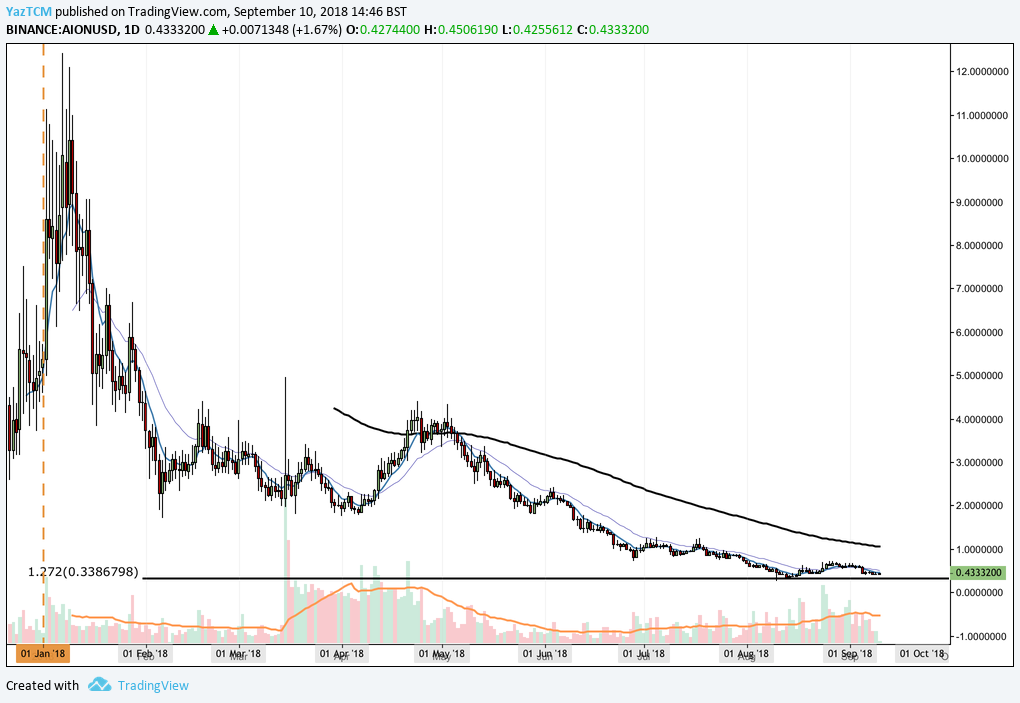
Analyzing the market from the long-term perspective above, we can see that price action had experienced a bullish run towards the end of 2017 as the market started from a low of $2.58 on December 22, 2017 and extended to an all-time high of $12.43 on January 7, 2018. This was a price increase totaling 400% from low to high.
We can see that after the market placed the all-time high, price action began to immediately roll over and decline rapidly. The market continued to decline throughout the rest of the year of 2018 until a form of support was found recently at the downside 1.272 Fibonacci Extension level priced at $0.33.
We can see that as the market approached this level it was rejectedm causing the market to rebound higher.
Let us continue to analyze price action a little closer over the short term to highlight any potential support and resistance areas.
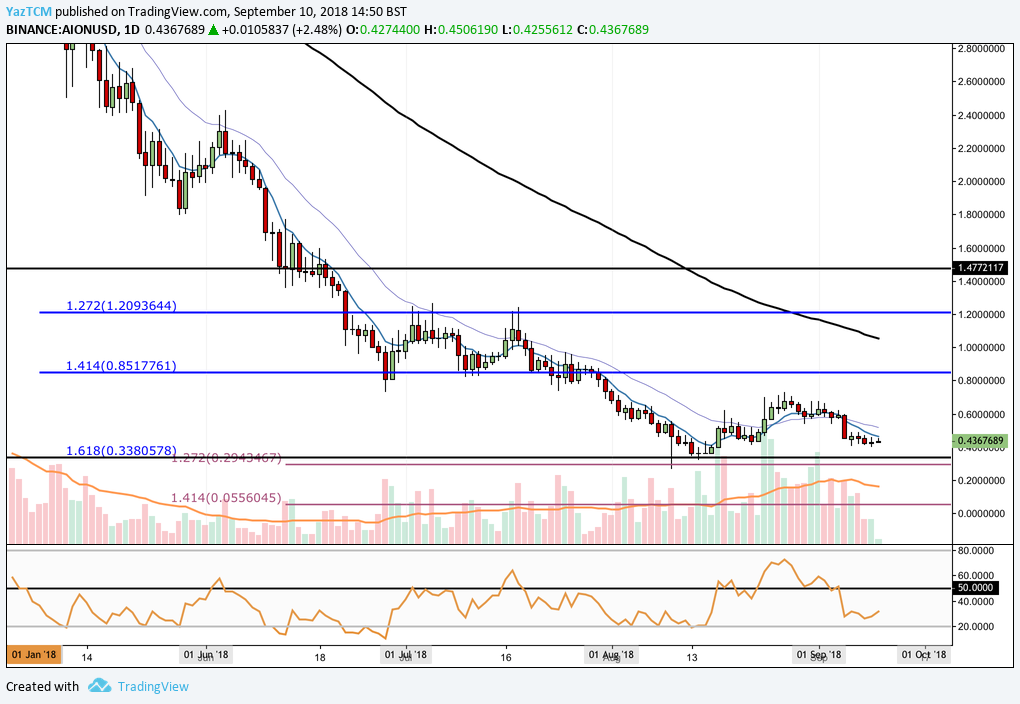
AION/USD – SHORT TERM – DAILY CHART
Analyzing the market from the short-term perspective above, we can see that the support located at the long-term downside 1.272 Fibonacci Extension level priced at $0.33 was significantly bolstered by a further shorter-termedownside 1.618 Fibonacci Extension level (drawn in blue) priced at the same level. This area provided ample support for the market to rebound from this level.
We can see that, since the beginning of August 2018, price action has been trapped within a range bound between the downside 1.414 and 1.618 Fibonacci Extension levels (drawn in blue) priced at $0.85 and $0.33 respectively.
If the market continues with the recent downward trajectory, we expect immediate significant support to be located at the lower boundary of the range priced at $0.33. If the market can penetrate below this level, we expect further support to be located at a shorter-term downside 1.272 Fibonacci Extension level (drawn in lilac) priced at $0.29. We can see that this area of support had provided stability for the market previously in August 2018.
Further expected support below this level can then be located at the psychological round number handle of $0.20.
Alternatively, any upside potential is expected to meet resistance at the upper boundary of the trading range priced at $0.85. If the market can breakout higher from the upper boundary, we expect immediate resistance above to be located at the psychological round number handle of $1. This area of resistance will require significant momentum and volume to be overcome due to the 100-day moving average hovering within this trading area.
Further resistance expected above this level can then be located at the previous 1.272 Fibonacci Extension level (drawn in blue) priced at $1.20.
The technical indicators within the market are currently favoring the bears at this moment in time. The RSI is trading underneath the 50 handle, indicating that the bearish momentum is in control within the market. The RSI has traded underneath the 50 handle for the majority of the past 2 trading months.
If we would like to see some upside movement within the market, we would need to see the RSI making its way toward the 50 level and maintain a break above.
Let us continue to quickly analyze price action relative to Bitcoin within this market.
AION/BTC – LONG TERM – DAILY CHART
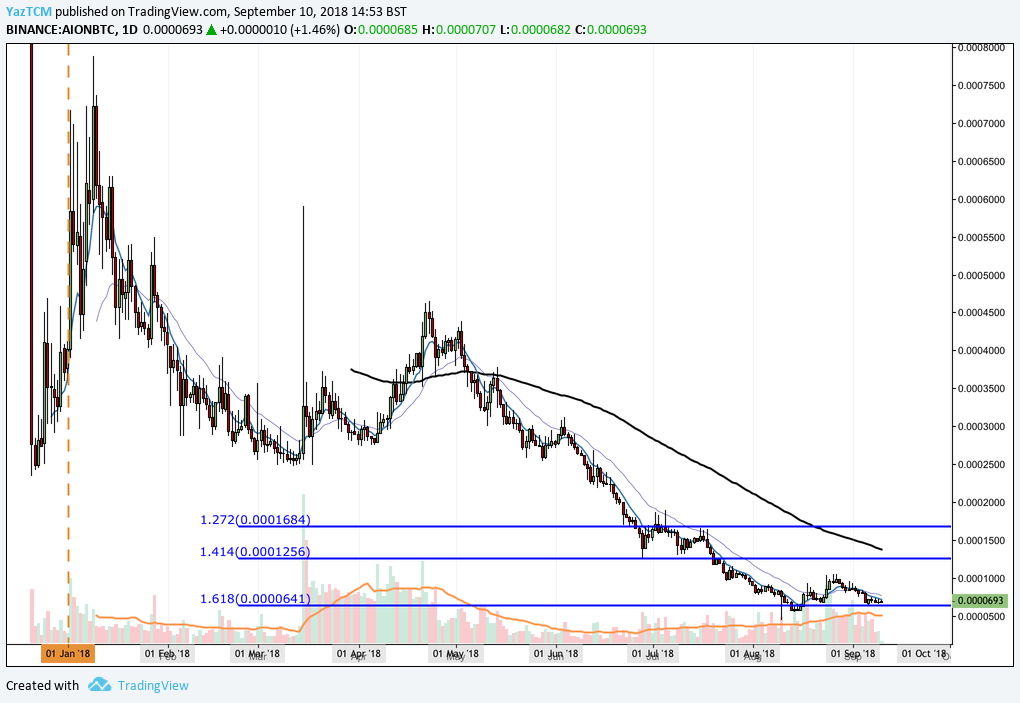
Analyzing the market from the long-term perspective above, we can see that price action had experienced a bullish run towards the end of 2017 when the market started from a low of 2,420 SAS on December 22, 2017 and extended to an all-time high of 7,888 SATS on January 8, 2018. This was a price increase totaling 229% from low to high.
We can see that after placing the ATH, price action rolled over and began to decline rapidly. The market has recently found a significant level of support located at the downside 1.618 Fibonacci Extension level (drawn in blue) priced at 641 SATS. This level of support has proven its validity during August 2018, and is expected to continue to hold the market moving forward.
Let us continue to analyze price action from a closer time frame to highlight any potential areas of support and resistance.
AION/BTC – SHORT TERM – DAILY CHART
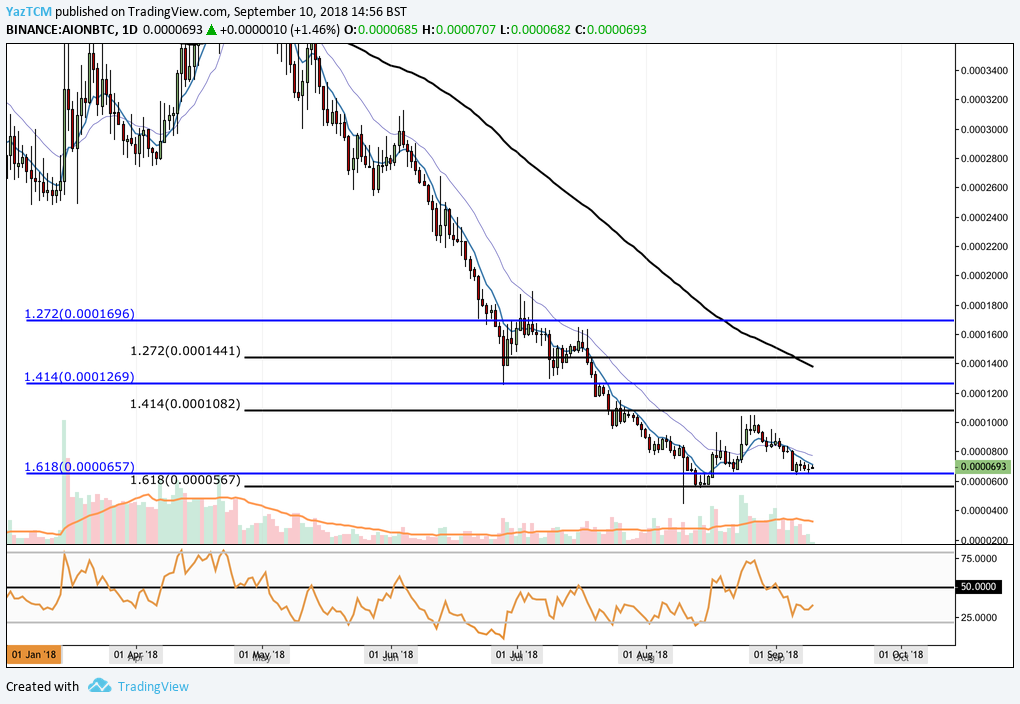
Analyzing the market from the benefit of a closer time horizon, we can see that the recent bearish movement had found support specifically at a shorter-term downside 1.618 Fibonacci Extension level (drawn in black) priced at 567 SATS.
We can also see that since the end of July 2018 price action has been trapped within a range bound condition, between the 1.414 and 1.619 Fibonacci Extension levels (drawn in black) priced at 1,082 SATS and 567 SATS, respectively.
Price action is currently trading at support provided by the longer-term 1.618 Fibonacci Extension level (drawn in blue) priced at 657 SATS. If the bearish sentiment continues, we expect immediate support to be located at the lower boundary of the trading range priced at 567 SATS.
Further support below this level can then be expected at the psychological round number handles of 550 SATS and 500 SATS.
Alternatively, if the bullish pressure re-enters the market, we expect immediate resistance to be provided at the upper boundary of the trading range priced at 1,082 SATS. Further resistance above this level can then be expected at the downside 1.414 Fibonacci Extension level (drawn in blue) priced at 1,269 SATS.
The 100-day moving average is currently hovering slightly above this level at a price of 1,380 SATS and the market will require significant volume to break above this area of resistance.
Related: AION Token Swap Scheduled for September to November 2018

