Augur has experienced a bullish week as prices appreciate by 15% over the last 7 trading days, after trading through 2 months of declining prices. Augur is currently trading around $35.82 and is up 2.75% over the past 24 hours alone.
The platform was created to become a decentralized prediction market where users can forecast specific outcomes of future events. It is different to existing prediction markets as it is decentralized on the Ethereum blockchain and ran through smart contracts so there is no need for a central authority.
Co-founded by Jack Peterson and Joey Krug, Augur was to become the first open source, peer-to-peer decentralized prediction market running as a dapp. Experts have suggested that Augur could potentially be the most complicated dapp on Ethereum.
The decentralized prediction market incentivizes users to report correct outcomes for specific events through it’s token known as Reputation or REP. Rep is used to report on the outcome of the event in the month following the event. After a consensus has been generated those Rep holders that were honest are rewarded and those that were dishonest lost Rep. For more information on Augur and its token REP please refer to our “What is Augur” article.
Augur is currently ranked 36th in terms of overall market cap across the entire industry, with a market cap value of $394 million. Augur is currently 32 months old and has a hard cap supply of 11 million cons making it a relatively low supply compared with other coins.
Augur currently has an upcoming mainnet launch scheduled for July 9 where all REP tokens will be officially moved to the mainnet. With such exciting times ahead we are likely to see some price hikes after the mainnet launches.
Let us analyze price action of the long term and see how REP has been trading.
Price Analysis
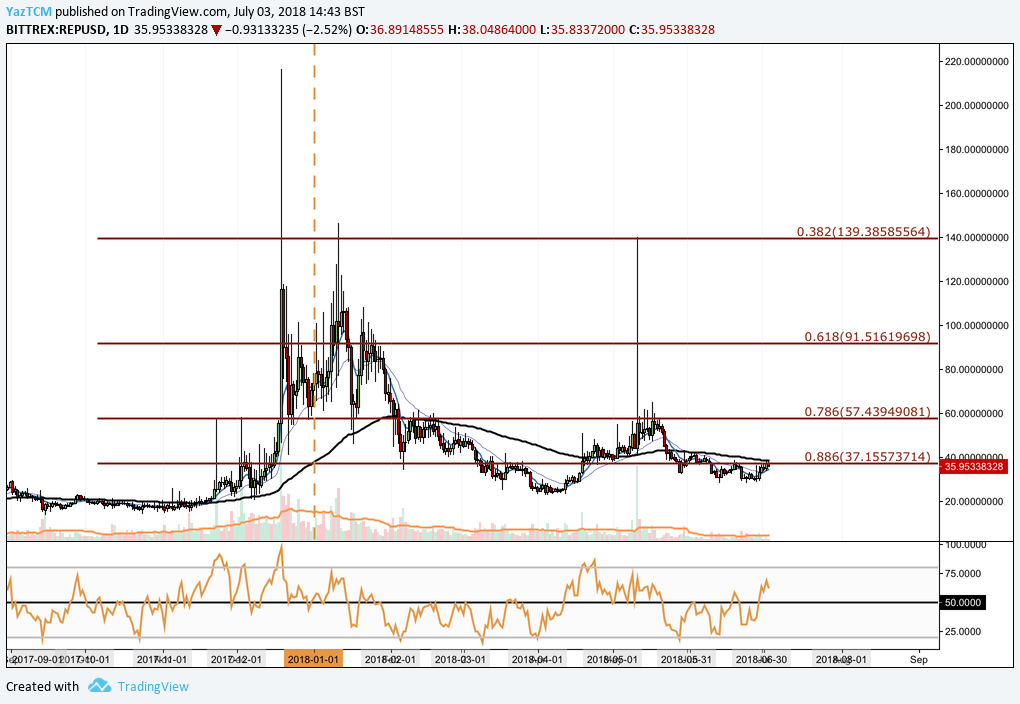
REP/USD – LONG TERM – DAILY CHART

https://www.tradingview.com/x/jffJ4YbU/
Analyzing the market from the long-term perspective above, we can see that price action had experienced a bullish run toward the end of 2017 as price rose from a low of $14.17 on November 2, 2017 to an all time high of $216.45 placed on December 19, 2017. This was an incredible price increase of over 1,400% from low to high.
After placing this all-time high, price action went on to depreciate throughout the first half of 2018 before placing a yearly price low during April at a value of $22.67. This price drop had taken the market far below the .886 Fibonacci Retracement priced at $37.15 and almost close to the low experienced before the late-2017 bull run. The Fibonacci Retracement is taken from the entire bull run outlined above.
Price action went on to break above the .886 Fibonacci Retracement after posting the yearly low before meeting resistance at the .786 Fibonacci Retracement priced at $57.43. It is also important to point out that the market had experienced an enormous short-term pump on May 11, 2018 as Binance announced that they were adding Augur to their platform. This caused the price of Augur to momentarily spike by up to 230% in price before returning back to normal levels.
The market is currently, once again, involved in a battle with resistance located at the .886 Fibonacci Retracement. This price level also confluences with the 100-day moving averages adding to the strength of resistance in the area. If price action can break and hold above the .886 Fibonacci Retracement, this would leave the market free to battle near-term resistance located higher at the .786 Fibonacci Retracement priced at $57.43. If the market can clear this level, price action would be creating multi-month fresh highs not seen since January 2018.
Alternatively, if the market is overpowered by the resistance found at the .886 Fibonacci Retracement, then short-term support can be found at June’s lows around $30. Further long-term support can be found at the yearly low priced at $22.67.
Let us analyze price action over the more recent period a little closer.
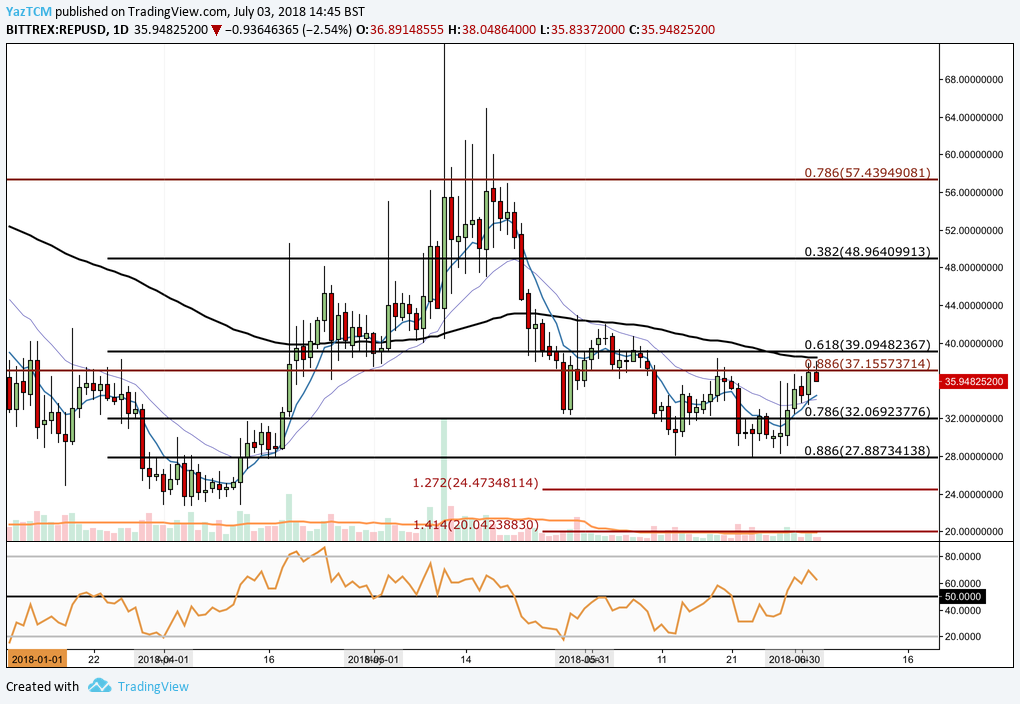
REP/USD – SHORT TERM – DAILY CHART

https://www.tradingview.com/x/ElscQQ2a/
Looking at the short-term price chart above, we can see that REP had experienced a bullish run starting from the yearly low of $22.67 in April and rising to a high of $64.88 experienced on May 17, 2018 (ignoring the momentary spike high caused by the Binance announcement). This was a price increase close to 190% from low to high.
Price action went on to depreciate, originally finding some support at the short term .618 Fibonacci Retracement priced at $39.09 in May, before collapsing in June and falling to the .886 Fibonacci Retracement priced at $27.88. These short-term Fibonacci Retracements, marked in black, are taken from the bullish run seen during April and May.
As July came around, the market had garnered some bullish momentum and pushed prices higher back toward where they are currently trading at the long term .886 Fibonacci Retracement (marked in red), priced at $37.15. We can see that as the market hit this level it was met with resistance and the market rolled over slightly.
If the market can continue with the recent bullish momentum experienced and break above the .886 Fibonacci Retracement, then near-term resistance is only located slightly higher marked by the $40 handle. This resistance is also bolstered by the short-term .618 Fibonacci Retracement priced at $39.09 and the 100-day moving average at the same price level. The market will need some significant momentum to break through this level of reinforced resistance. If the market can clear $40, then it will be free to test further resistance experienced in May at the long term .786 Fibonacci Retracement priced at $57.44.
Alternatively, if the .886 Fibonacci Retracement level proves too much for the bulls, then near-term support can be found at $32.06 and $27.88. These are the .786 and .886 Fibonacci Retracements respectively. Further support below $27.88 is located at the 1.272 Fibonacci Extension level priced at $24.47.
The technical indicators are largely favoring the bulls at this moment in time. The RSI is trading well above the 50 handle indicating the increased bullish momentum within the market. If the RSI can continue to stay above the 50 handle, this will indicate that the bullish momentum can continue.
To add further to this, the 7-day EMA (blue line) has recently crossed up above the 21-day EMA (purple line) indicating that the market is in the process of a short-term bullish trend reversal.
Conclusion
With the mainnet launch looming over the next few days, we expect that the market may trade sideways for a period of time as investors tend not to trade during major fundamental developments such as a token migration. However, after the mainnet launches we expect the market to react in its recently displayed fashion and continue to appreciate in value.

