- Cardano had found support at a downside 1.414 Fib Extension during September 2018, stabilizing the market slump.
- Price action is now trading in a range between $0.060 and $0.094.
- Expected support levels: $0.07, $0.065, $0.061, $0.060.
- Expected resistance levels: $0.077, $0.089, $0.0945, $0.102, $0.107, $0.11.
The Cardano market is positioning itself to break above the $0.10 handle, so long as price action can clear resistance at $0.09. The market has not managed to break above the $0.10 handle since early September 2018.
ADA has seen a small increase in value totaling 2.48% over the past 24 hours of trading, bringing the current trading price up to around $0.077. The RSI technical indicator is now producing a neutral reading as traders wait for a break above 50 to confirm the bulls are back in control.
The 12-month old cryptocurrency currently holds a market cap value of $1.94 billion, which brings its ranking to the 9th position in terms of overall market cap. After suffering a steep decline totaling 58% over the past 90 trading days, it seems like ADA/USD is starting to show signs that it is ready to regain some of the losses incurred over the past few months. The cryptocurrency is still trading at a value that is 93% lower than its all-time high (ATH) price.
For an update on the Cardano roadmap, take a look at “Cardano Updates Their Roadmap: What’s Coming Next in Q4 2018.”
Let us continue to analyse price action for ADA/USD over the long term and get an overview of price action over the course of the year.
Cardano Price Analysis
ADA/USD – LONG TERM – DAILY CHART
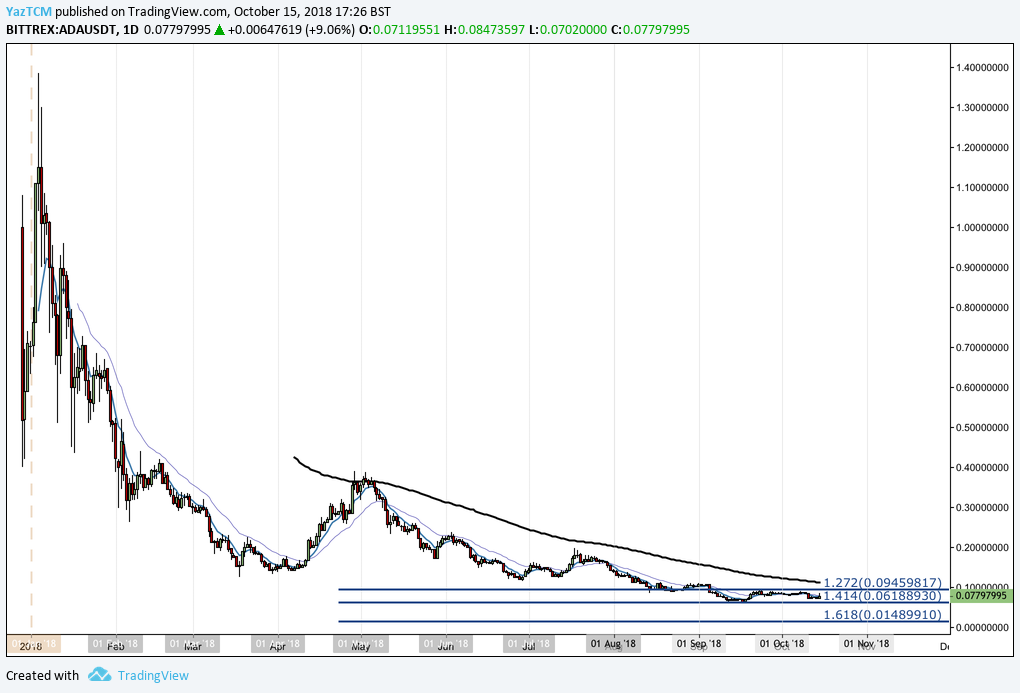
Assessing price action from the long-term viewpoint above, we can see that the market conditions have not been kind for ADA/USD over the course of the year.
After the market had established its ATH price of $1.38 on January 4, 2018, the bulls in the market have constantly capitulated against the bears over the entire trading year, leading to the market decline seen on the chart.
We can see that ADA/USD has recently established some form of solid support at a long-term downside 1.414 Fibonacci Extension level priced at $0.06188 during September 2018. As the market hit this level, we can see ADA/USD rebounding as it makes its way back toward the ever elusive psychological $0.10 round number handle.
Let us continue to analyze price action a little closer over the shorter term to a certain any potential support and resistance levels moving forward.
ADA/USD – SHORT TERM – DAILY CHART
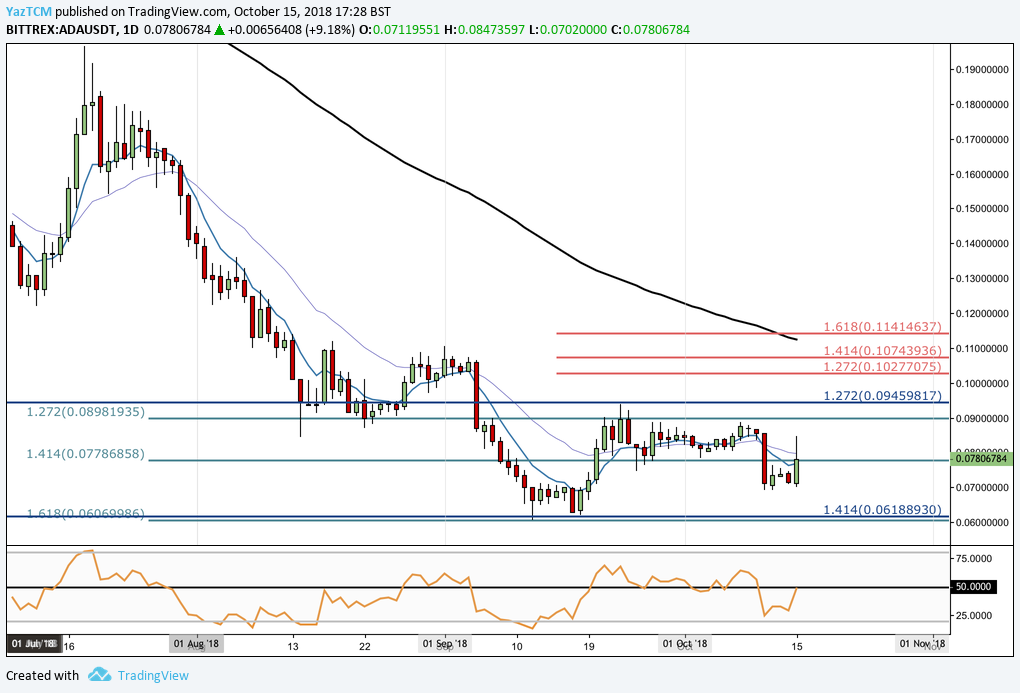
Investigating the ADA/USD market at a closer distance, we can see that the support at the long-term downside 1.414 Fibonacci Extension level was further reinforced by a short-term downside 1.618 Fibonacci Extension level (drawn in turquoise) priced at $0.6069. As ADA/USD approached this level of support in September 2018, we can see that the bulls defended the level aggressively, causing price action to reverse.
The market then went on to rally until meeting significant resistance at the long-term downside 1.272 Fibonacci Extension level (drawn in blue) priced at $0.09459. As ADA/USD met this level, the bears increased their pressure, suppressing the market from passing above $0.094.
As the sideways movement within the market continues, the ADA/USD market has now established a 6-week trading range bound between the long-term downside 1.272 Fibonacci Extension level priced at $0.094598 as the upper boundary and the short-term downside 1.618 Fibonacci Extension level (drawn in turquoise) priced at $0.060 as the lower boundary of the trading range.
We can see that price action is now trading at resistance provided by the short-term downside 1.414 Fibonacci Extension level (drawn in turquoise) priced at $0.077.
If the bullish pressure can increase in the BTC/USD market, this will cause ADA/USD to continue to increase (so long as ADA/BTC does not fall). If the bulls can push the market above $0.077, then we can expect immediate resistance above to be located at the short-term and long-term downside 1.272 Fibonacci Extension levels priced at $0.089 and $0.094 respectively.
If the bulls can clear the $0.094 handle, then the next higher level of significant resistance will be the psychological $0.10 round number handle. Expected resistance above this can then be located at the short-term 1.272 and 1.414 Fibonacci Extension levels priced at $0.102 and $0.107.
The 100-day moving average is currently hovering around the $0.11 handle and the market will need a large surge in volume to conquer this resistance level.
On the other hand, if the bears regroup and re-establish their downward pressure, we can expect immediate support below at the lower boundary of the trading range priced at $0.060.
The RSI is trading along the 50 handle, indicating that neither the bulls nor the bears are now in dominant control of the market. The recent rise of the RSI from oversold conditions may indicate that the previous bearish momentum has faded. However, we must wait for a confirmation of the RSI above the 50 handle to commit to any bullish trades higher.
Let us continue to analyse price action for ADA/BTC over the short term and highlight any expected potential support and resistance areas.
ADA/BTC – SHORT TERM – DAILY CHART
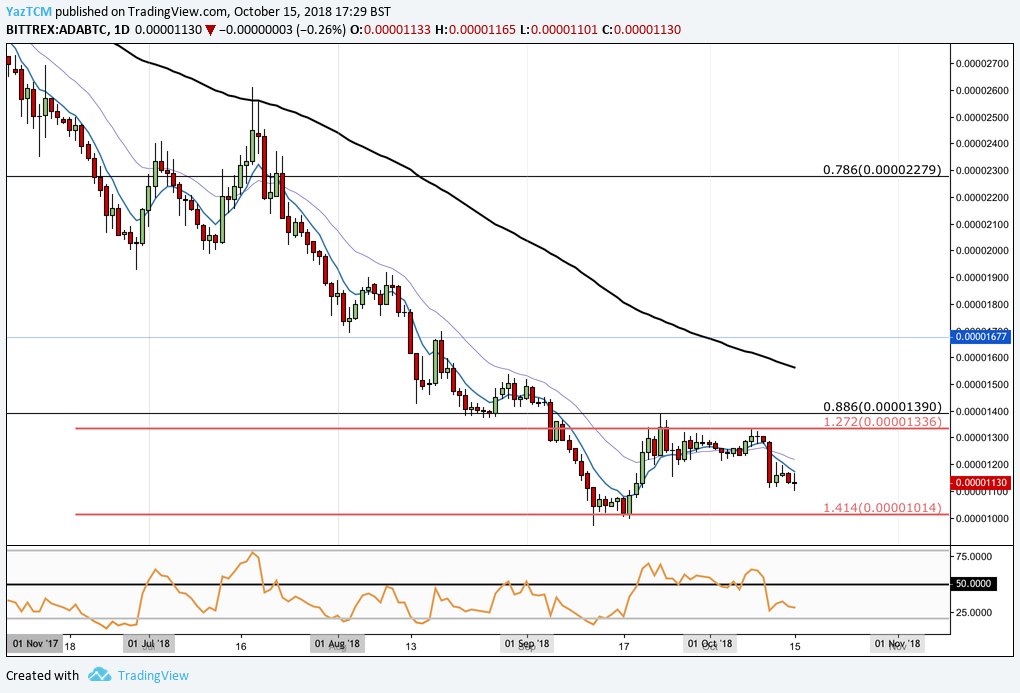
Examining the chart above which depicts ADA/BTC, we can see that ADA had also recently found support against BTC during September 2018 as the market had reached the downside 1.414 Fibonacci Extension level priced at 1,014 SATS. As price action approached this area, the bulls re-entered the market which caused the ADA/BTC market to rally up into resistance at the downside 1.272 Fibonacci Extension level priced at 1,336 SATS.
These 2 price levels form the trading range which ADA/BTC has been trading within over the past 6 weeks.
We can see that the recent BTC/USD price increase has caused a small sell-off in ADA against BTC. If the sell-off continues, we can expect immediate support below to be located at the psychological round number handle of 1,100 SATS, followed by the lower boundary of the established trading range at 1,014 SATS.
Alternatively, if the bulls can start to buy up ADA/BTC and push prices higher, we can expect immediate resistance above to be located at the upper boundary of the trading range at 1,336 SATS. If the buys continue to drive price action higher, more resistance can then be expected at 1,390 SATS, followed by the 1,450 and 1,500 SATS handles.
Worryingly, the RSI technical indicator is currently trading underneath the 50 handle, indicating that the bears are in control of the momentum within the market. If we would like to see price action appreciate in ADA/BTC, we would need to see the RSI make its way back above the 50 handle.


