- Zcash has shown some signs of stabilization around the $104 handle.
- The market has now established a trading range between $104 and $140.
- Support Moving Forward: $110, $104.69, $100, $88.02.
- Resistance Moving Forward: $140, $150, $163.92, $200, $233.56, $293.08.
Zcash has recently witnessed a 6.83% price hike over the past rolling 7 trading days. The privacy-focused cryptocurrency is presently exchanging hands at a price around $119 after experiencing a 36% decline over the past 90 trading days.
However, the cryptocurrency has shown signs of recent stabilization as traders speculate if ZEC will be the next coin to be added to Coinbase. The crypto exchange giant has recently added 0x to its service, fueling speculation for the further addition of other previously mentioned coins by the company.
Zcash has now moved into the 20th position in terms of overall market cap. It holds a total market cap value of $594 million as the 24-month old coin currently trades at a price that is 86% lower than its all-time high value.
Let us continue to analyse price action for Zcash over the long term and overview how the market has been behaving.
Zcash Price Analysis
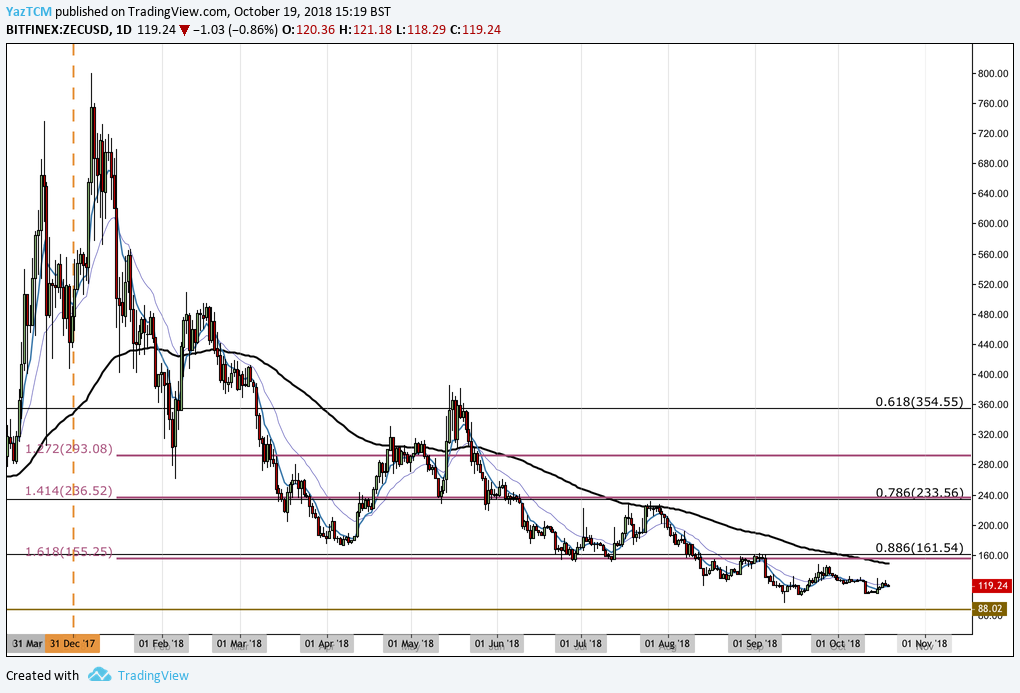
ZEC/USD – LONG TERM – DAILY CHART
Looking at the ZEC/USD market chart above, it is evident that the year has not been comfortable for Zcash. The market has consistently fallen over the course of the current trading year after reaching its all-time high price of $799.26 on January 7, 2018.
The market had reached a form of relatively strong support at the .886 Fibonacci Retracement level priced at $161.54 during June 2018. Due to the confluence of support in this area, we had expected this level to hold. However, the market penetrated below this level during August 2018 and continued lower as it approached $100.
Let us continue to analyze price action a little closer over the shorter period and update any potential support and resistance levels moving forward.
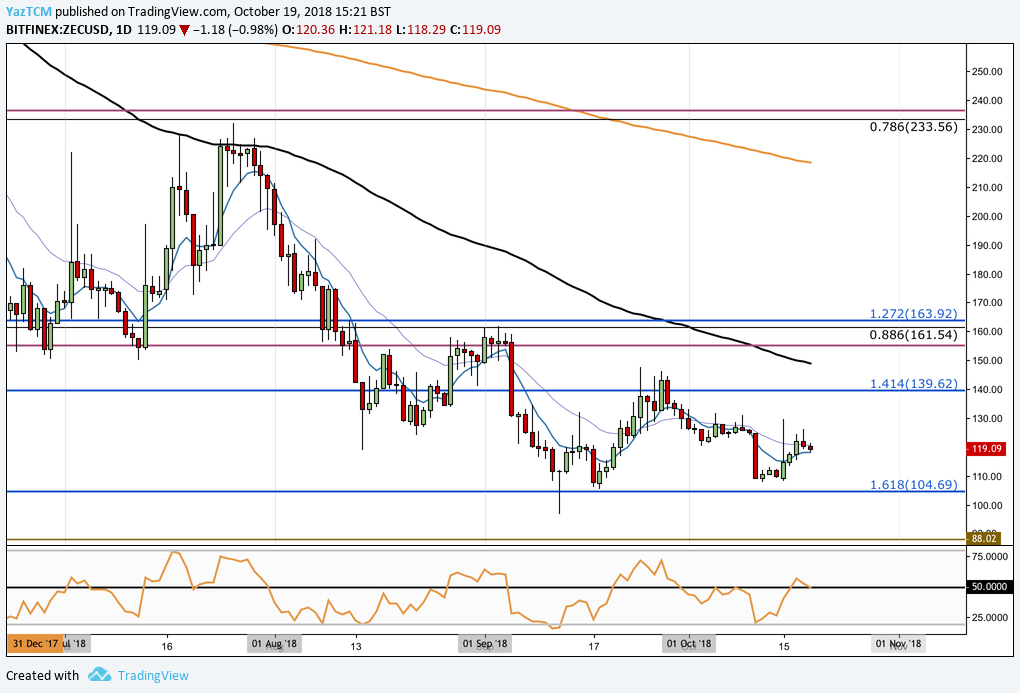
ZEC/USD – SHORT TERM – DAILY CHART
If we analyze the market at a closer perspective, we can see that the recent market decline had reached support at a downside 1.618 Fibonacci Extension level (drawn in blue) priced at $104.69. As the market approached this area, it showed signs of resilience and rebounded.
We can see that ZEC/USD has now established a trading range between the $104 handle as the lower boundary and the $140 handle as the upper boundary of the range.
If the bulls regather momentum on the speculation that ZEC will be added to Coinbase, we could see ZEC/USD rocket above the upper boundary of the range. In this scenario, we can expect immediate resistance above to be located at the 100-day moving average, which currently is hovering around the $150 handle.
If the bulls continue further higher, we can expect higher resistance at the downside 1.272 Fibonacci Extension level (drawn in blue) priced at $163.92. Further resistance above will then be located at the psychological round number at the $200 handle, followed by resistance provided by the July 2018 high at $232.
On the other hand, if the bears manage to overpower the bulls and push price action lower, we can expect immediate support beneath to be located at the lower boundary of the range at $104.69, followed by the $100 handle. If the bulls manage to penetrate ZEC/USD below $100, we can expect further support at the May 2017 low at $88.02.
The RSI indicator within the market is producing a neutral reading as it rests on the 50 handle. If the RSI breaks above 50, we can expect the bullish momentum to push price action higher within the market.
Another sign that the bullish pressure is increasing would be if the short term 7-day moving average (blue moving average) crosses up above the longer termed 21-day moving average (purple moving average) to produce a bullish crossover signal.
Let us continue to quickly analyze ZEC relative to BTC over the short term and highlight any potential support and resistance zones.
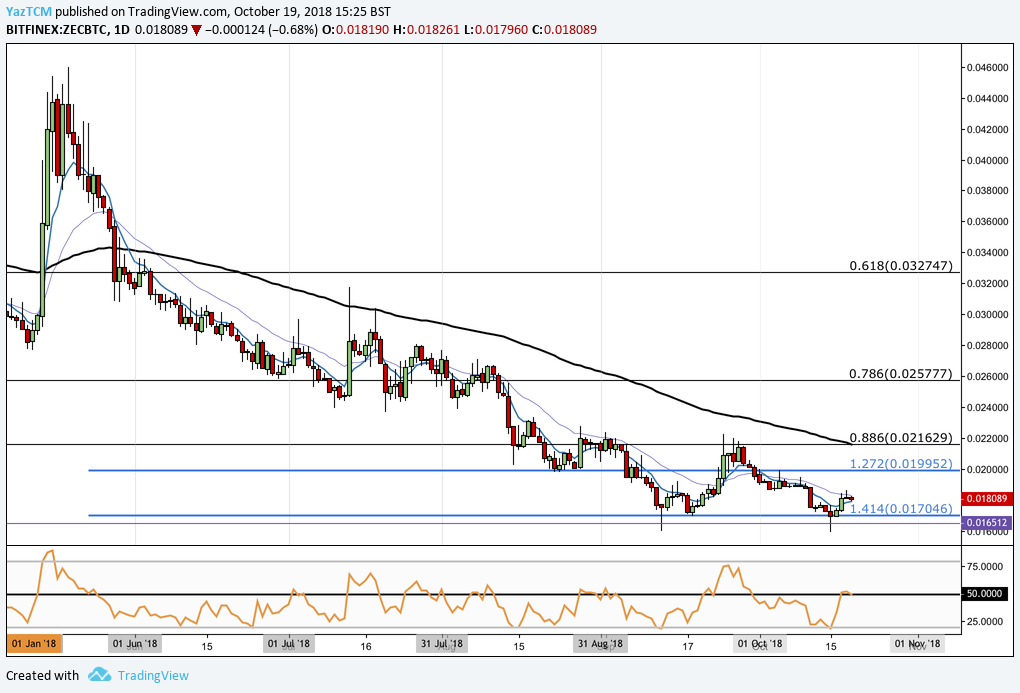
ZEC/BTC – SHORT TERM – DAILY CHART
Inspecting the market relative to BTC, we can see that ZEC has been depreciating over the previous 5 months.
The price decline has recently shown some signs of relative stability during September 2018 when ZEC/BTC had reached support at a downside 1.414 Fibonacci Extension level priced at 0.017046. As the market approached this level, the bulls began to defend the area, causing price action to rally.
We can see that the market then went to rise until meeting resistance at the long-term .886 Fibonacci Retracement level priced at 0.021629 before rolling over. ZEC/BTC has now rebounded off the support at the downside 1.414 Fibonacci Extension level once again during October 2018.
Price action has now established a trading range with the 0.021629 level acting as the upper boundary and the 0.017046 level acting as the lower boundary of the range.
If ZEC does get added to Coinbase and the “Coinbase Effect” comes into play, we can expect price action to start to appreciate quickly. Initially resistance can be expected at the downside 1.272 Fibonacci Extension level priced at 0.019952, but the momentum will likely push the market toward the upper boundary of the trading range quickly.
Resistance at the upper boundary is further bolstered by the 100-day moving average which is trading directly on top of the boundary. Further resistance above the trading range can be expected at the .786 Fibonacci Retracement level priced at 0.025777.
Alternatively, if the bears do manage to pressure price action lower, we can expect significant support below at the lower boundary of the trading range.


