- Support for XRP moving forward: $0.3118, $0.3106, $0.3028, $0.2989, $0.2858.
- Resistance for XRP moving forward: $0.3291, $0.3361, $0.3449, $0.3635, $0.3943.
Latest Ripple News
The CEO of Ripple, Brad Garlinghouse, remains optimistic about growth. He recently stated that he believes that the cryptocurrency is in the midst of gaining more adoption, evidenced by the increase in number of partnerships the company has been creating.
In other Ripple news, the blockchain firm, R3, has recently launched their Corda Network. XRP will benefit from this as they are the 1st cryptocurrency to be supported by the Corda Settler app.
XRP/USD Price Analysis
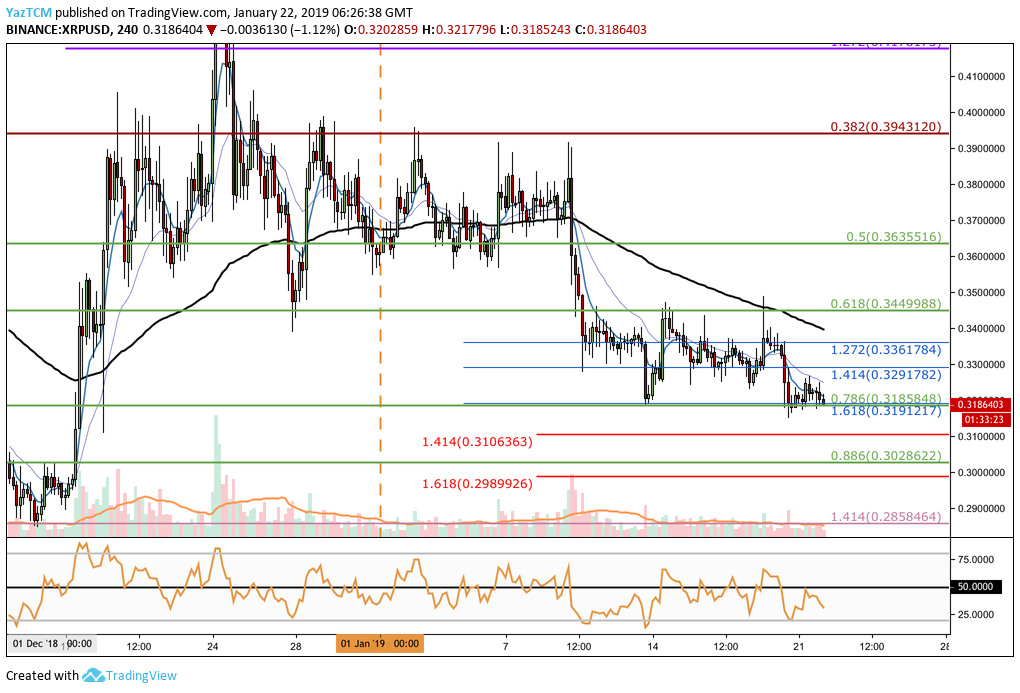
Analyzing the market from the 4-hour perspective above, we can see that the market has now reached the lower boundary of the trading range (previously identified in our last XRP/USD analysis) at the short-term .786 Fibonacci Retracement level (drawn in green) priced at $0.3185.
The market attempted to break above the upper boundary of the trading range at the short-term .618 Fibonacci Extension level (drawn in green) priced at $0.3449 but failed to close above this level. This may be largely due to the fact that BTC/USD has experienced a price fall of around 7% this week.
Trend: Neutral
The market is still within the trading range between $0.3449 and $0.3185, leading to the current trading condition to be neutral.
However, if either XRP/BTC or BTC/USD falls lower and causes XRP/USD to break below the $0.3185 support at the lower boundary of the trading range, then our trading condition will be turned into a bearish one.
Where is the Support Located Below the Trading Range?
If the sellers do manage to push price action below the established trading range, we can expect further immediate support towards the downside to be located at the medium-term downside 1.414 Fibonacci Extension level (drawn in red) priced at $0.3106.
Support following this is located at the short-term .886 Fibonacci Retracement level (drawn in green) priced at $0.3028.
If the bears continue to drive price action further below the $0.30 handle, expect more support at the medium-term downside 1.618 Fibonacci Extension level (drawn in red) priced at $0.2989. This is followed by the previous long-term downside 1.414 Fibonacci Extension level (drawn in lilac) priced at $0.2858.
Where is the Resistance Now Located Above the Market?
Alternatively, if the bulls begin to regroup and drive price action higher for XRP/USD, we can expect immediate support above to be located at the previous short-term downside 1.414 and 1.272 Fibonacci Extension levels (drawn in blue) priced at $0.3291 and $0.3361, respectively.
Further resistance above this level can be found at the upper boundary of the range at the short-term .618 Fibonacci Retracement level (drawn in green) priced at $0.3449.
If the buyers can push price action above the current trading range, higher resistance is located at the short-term .5 Fibonacci Retracement level (drawn in green) priced at $0.3635. More resistance is found at the bearish .382 Fibonacci Retracement level (drawn in red) priced at $0.3943.
XRP/BTC Price Analysis
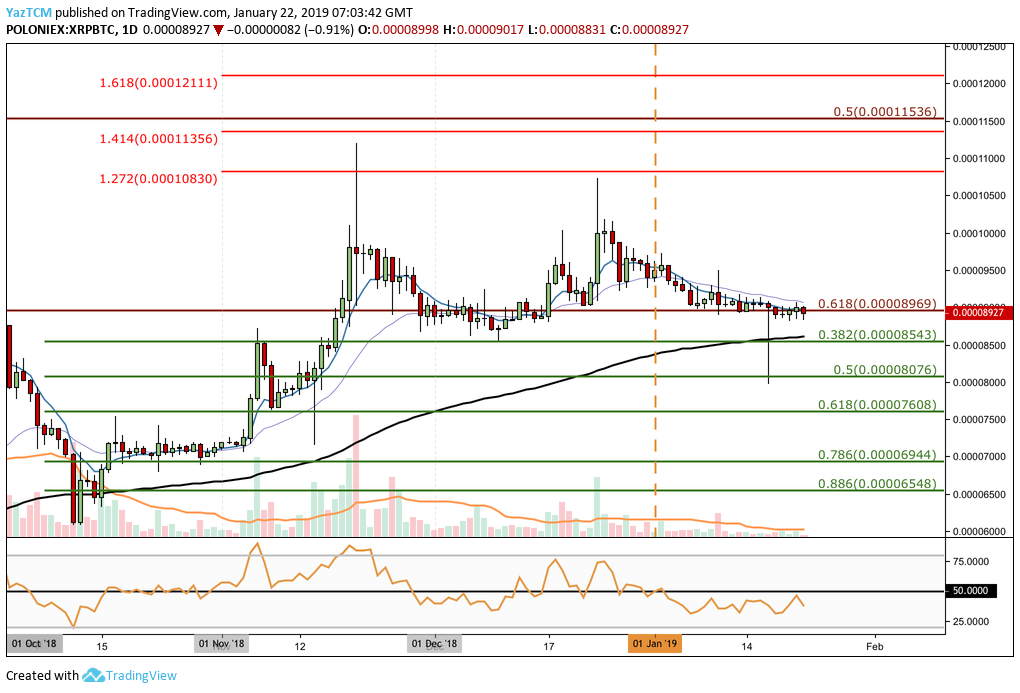
Analyzing the market from the past few months on the daily chart above, we can see that after the market had rebounded at a low of 6,083 SATS on October 12, 2018, it went on to increase by a total of 65% and reached a high of around 10,186 SATS on December 25, 2018.
This price increase occurred at a time, largely in November 2018, when the rest of the cryptocurrency industry was experiencing a market capitulation as price action plummeted for the majority of cryptocurrencies.
Price action is now trading at a long-term .618 Fibonacci Retracement level (drawn in red) priced at 8,986 SATS. This long-term Fibonacci Retracement is measured from the low in December 2017 to the high in January 2018.
Trend: Neutral
The market is trading within the confines of the previous swing leg higher so it is still in a neutral trading condition.
For XRP/BTC to be considered bullish, we would need to see price action break cleanly above the 10,000 SATS handle.
Where is the Support Below the Current Market Price?
If the sellers ramp up the pressure and begin to push price action lower, we can expect immediate support towards the downside to be located at the short-term .382 and .5 Fibonacci Retracement levels (drawn in green), priced at 8,543 SATS and 8,076 SATS respectively.
Further support below this can be expected at the short-term .618 and .786 Fibonacci Retracement levels (drawn in green), priced at 7,608 SATS and 6,944 SATS respectively.
Where is the Resistance Above the Market?
If the buyers start to regroup and push price action above the current support at the long-term .618 Fibonacci Retracement level (drawn in red) priced at 8,969 SATS, the bulls will encounter higher resistance at the 10,000 SATS handle.
If the bulls can break above 10,000 SATS, expect higher resistance at the short-term 1.272 and 1.414 Fibonacci Extension levels (drawn in red), priced at 10,830 SATS and 11,356 SATS respectively.
Further resistance above this can then be found at the bearish .5 Fibonacci Retracement level (drawn in red) priced at 11,536 SATS.
What are the Technical Indicators Showing?
The RSI is underneath the 50 level which indicates that the bears are in control of the momentum within the market. This means price action for XRP/BTC could be heading lower in the coming days.
Conclusion
XRP/USD is at a critical level which will determine if the next few weeks may be bearish.
If the market does break below the lower boundary at the $0.31 handle, we can expect price action to head into further support beneath around the $0.30 handle or even lower.


