- Support moving forward: $0.1036, $0.1000, $0.09866, $0.09477, $0.09329.
- Resistance moving forward: $0.1121, $0.1180, $0.1239, $0.1312, $0.1398, $0.1465.
Latest Stellar News
Digital asset firm Greyscale Investments, which provides institutional investment services, recently launched “Stellar Lumens Trust.” This is another investment vehicle that will allow institutions to invest in the cryptocurrency asset.
XLM Price Analysis
Stellar has seen a small price increase totaling 1.08% over the past 24 hours of trading, bringing the current trading page up to $0.1039, at the time of writing. The cryptocurrency has now seen a 2.73% price decline over the past 7 trading days, with a further 16.83% price fall over the past 30 trading days.
XLM has seen a significant 56% price decline over the past 90 trading days. The 54-month old project now trades at a value that is 87% lower than the all time high price.
Stellar is now ranked in 7th position as it currently holds a $1.98 billion market cap valuation. Litecoin, which is in 8th position, is currently closing in on Stellar as it sits only $70 million behind, at the time of writing.
XLM/USD Price
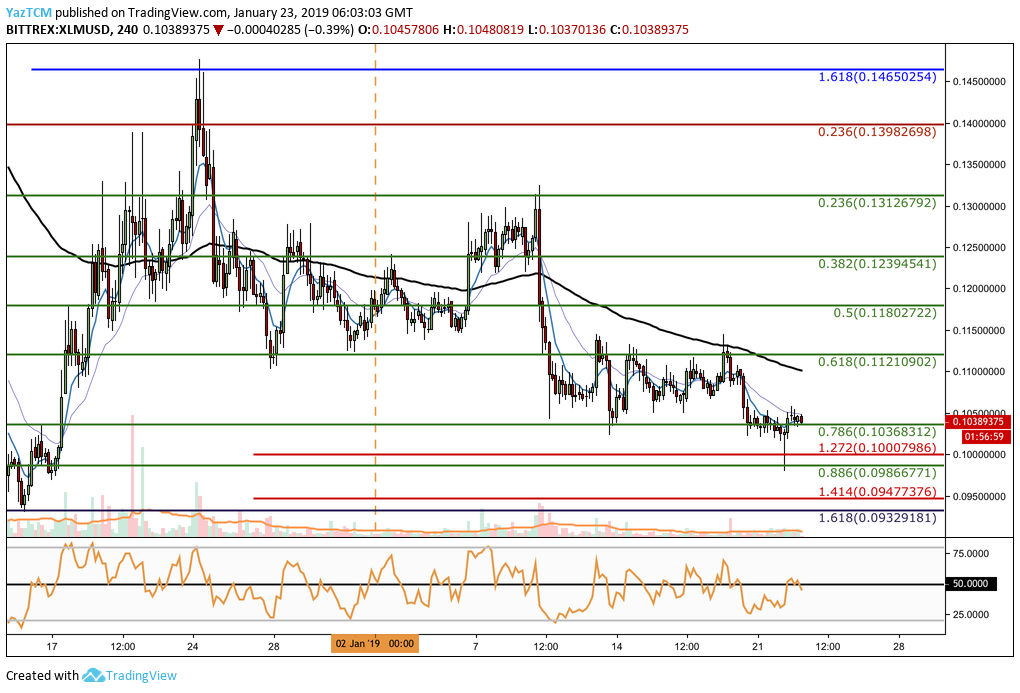
Analyzing price action from the short-term 4-hour perspective above, we can see that Stellar has been struggling since our last XLM/USD analysis. The market has fallen further, and is now trading at support provided by a short-term .786 Fibonacci Retracement level (drawn in green) priced at $0.103683.
The market experienced a brief fall on January 22, 2019 as price action briefly dropped lower into the short-term .886 Fibonacci Retracement level (drawn in green) priced at $0.09866.
Trend: Bearish in the Short Term
The recent penetration below the short-term .786 Fibonacci Retracement level (drawn in green) priced at $0.1036 has now caused the market to shift into a mild short-term bearish trend.
If price action can remain above this support level and head higher above $0.01121, we can then expect the trading condition to change into a bullish trading condition in the short term.
Where is the Support Further Beneath the Market?
If XLM/USD falls below the support at the short-term .786 Fibonacci Retracement level (drawn in green) priced at $0.10368, we can expect immediate further support at the short-term downside 1.272 Fibonacci Extension level (drawn in red) priced at $0.10007.
If price action breaks below the $0.10 handle,further support beneath can be located at the short-term .886 Fibonacci Retracement level (drawn in green) priced at $0.09866. Next, there is further support at the short-term downside 1.414 Fibonacci Extension level (drawn in red) priced at $0.09477.
More support below this can then be located at the previous long-term downside 1.618 Fibonacci Extension level (drawn in dark purple) priced at $0.09329.
Where is the Resistance Above the Current Market Price?
Alternatively, if the bulls regroup and begin to push price action higher, we can expect immediate resistance towards the upside to be located at the short-term .618 and .5 Fibonacci Retracement levels (drawn in green) priced at $0.1121 and $0.1180, respectively.
Further resistance above this is then at the short-term .382 and .236 Fibonacci Retracement levels (drawn in green) priced at $0.1239 and $0.1312, respectively.
If price action goes even higher, there is higher resistance at the bearish .236 Fibonacci Retracement level (drawn in red) priced at $0.1398.
XLM/BTC Price
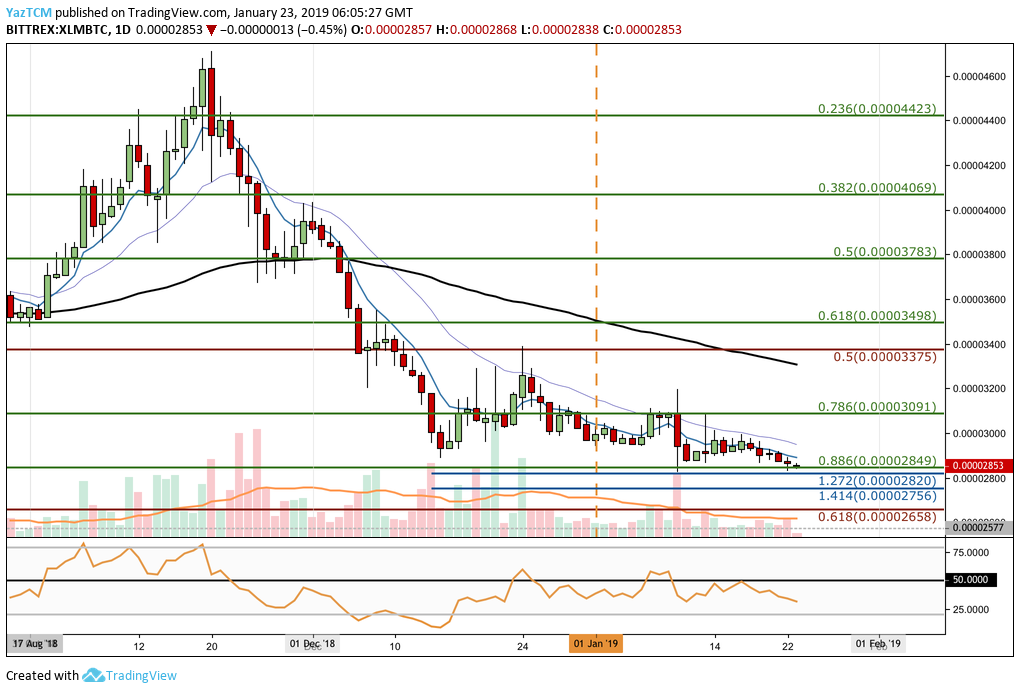
Analyzing XLM/BTC from the daily chart above, we can see that the market has struggled since falling from its high around 4,600 SATS in November 2018.
The market then fell by a total of 40% from this peak during December 2018 and January 2019, until support was recently reached at the short-term .886 Fibonacci Retracement level (drawn in green) priced at 2849 SATS.
Trend: Bearish in the Short Term
As the market has been consistently falling recently, the market is undoubtedly bearish at this moment in time. If the bulls can regroup and begin to push price action higher from the support at 2,849 SATS, then the market will return to a neutral trading condition.
A clean break above the 3,091 SATS handle would indicate a bullish XLM/BTC market
Where is the Support Located Below the 2,849 SATS Handle?
If XLM/BTC falls below the support at 2,849 SATS, immediate support towards the downside can be found at the short-term downside 1.272 and 1.414 Fibonacci Extension levels (drawn in blue), priced at 2,820 SATS and 2,756 SATS respectively.
If the market continues to break lower, there is more support located at a long-term .618 Fibonacci Retracement level (drawn in red) priced at 2,658 SATS. Further support below this is located at previous support at the 2,577 SATS level.
Where is the Resistance Above the Market?
If the bulls begin to push price action higher, they will immediately meet resistance above at the short-term .786 Fibonacci Retracement level (drawn in green) priced at 3,091 SATS.
The long-term .5 Fibonacci Retracement level (drawn in red) priced at 3,375 SATS is the next resistance point.
More resistance towards the upside can be located at the short-term .618 and .5 Fibonacci Retracement level (drawn in green) priced at 3,498 SATS and 3,783 SATS, respectively.
Conclusion
Stellar is currently in the middle of a rough time in the first month of 2019. However, if the bulls can defend the $0.10 handle, push higher and break above the $0.11 level, we could see XLM/USD traveling higher.


