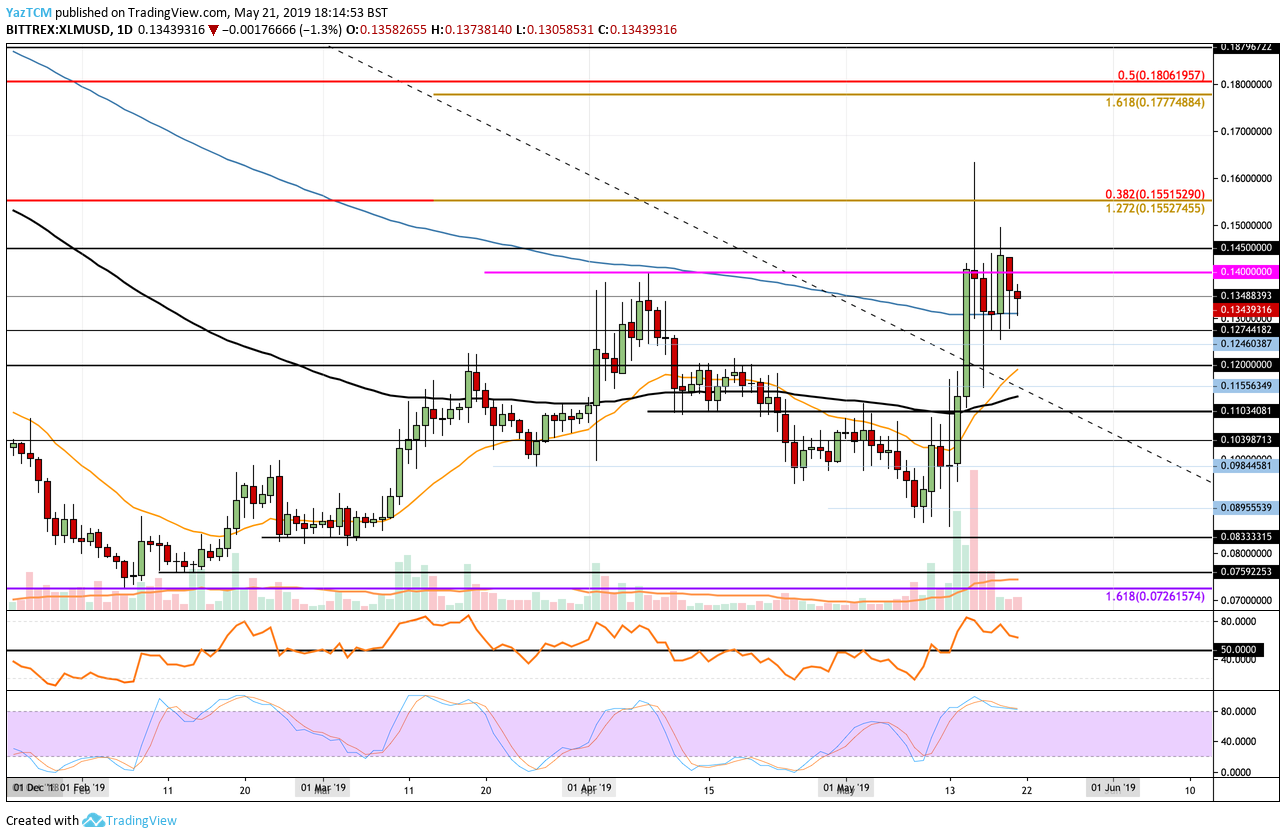
Stellar Lumens has seen an extraordinary price increase, totaling over 50%, from the May low and is currently trading around the $0.1343 level. The cryptocurrency has seen a 64% price increase over the past 90 trading days after the cryptocurrency managed to create a fresh 2019 high around the $0.165 level.
Stellar is now ranked in 9th position as it presently holds a $2.57 billion market cap valuation.

Source: CoinCheckup
In this article, we will take a look at where price action could head toward by the end of the week. Stellar has been trading above the 200-day moving average level for the past 7 trading days and is using this currently as strong support. If price action can remain above, we can expect XLM to increase by 16% and hit $0.155 by the end of the week.
However, the technical indicators are warning the bulls to execute extreme caution, as the market is overstretched. If the market retraces over the next few days, we can expect strong support to be found at the $0.1246 and $0.115 levels.
Let us take a look at the Stellar market and highlight some potential areas of support and resistance moving forward.
Stellar Price Analysis
XLM/USD – SHORT TERM – DAILY CHART

What Has Been Going On?
Analyzing the XLM/USD chart above, we can see that Stellar rebounded at the $0.0895 level during mid-May 2019 and proceeded to rally to a high above $0.16. However, Stellar could not maintain itself above $0.16, but still managed to close above $0.14.
During the recent period of consolidation, Stellar has remained supported by the 200-day EMA, which currently hovers around the $0.1320 area.
What Is the Current Trend?
The current trend for XLM/USD is presently neutral, as the market is trading in a range between $0.145 and $0.13. If the market can break above the $0.145 level, we can expect the trend to turn bullish. If price action were to dip beneath $0.13, then the trend would turn bearish.
What Are the Technical Indicators Showing?
The Stochastic RSI has positioned itself to deliver a bearish crossover signal in overbought territory, which suggests that the market is currently overextended, and could signal that a retracement will be on the cards over the next few days. This is further confirmed by the falling RSI, which signals that the buying pressure is decreasing.
Where Can Prices Head This Week?
If the sellers do manage to push the market beneath the 200-day EMA and beneath the lower boundary of the range at $0.13, we can expect immediate support beneath to be located at $0.1274 and $0.1246. If the sellers continue lower, we can expect more strong support to then be located at $0.12.
If the selling pressure pushes XLM/USD beneath $0.12, further support beneath can be expected at the $0.1155 and $0.110 levels.
Alternatively, if the bulls can defend the support at the 200-day EMA and push XLM/USD above the $0.145 level, we can expect immediate higher resistance above to be located at the $0.15 level. Above this, higher resistance is located at the $0.155 level, which is resistance provided by a long-term bearish .382 Fibonacci Retracement level (drawn in red), measured from the November 2018 high to the December 2018 low.
Above $0.155, further resistance be located at $0.16, $0.17, and at the bearish .5 Fibonacci Retracement level (drawn in red), priced at $0.1806.
Conclusion
Stellar is currently trading within a period of consolidation between $0.13 and $0.145, and the market could end up in either direction depending on which way the range breaks towards by the end of the week. Furthermore, the indicators are suggesting that the market is slightly overstretched which could lead to a retracement over the next few days.

