Tron has seen an impressive price increase totalling 11% over the past 24 hours of trading, bringing the current trading price up to $0.02689 at the time of writing. This price increase has largely been due to Bitcoin surging by 20% recently.
Tron has now seen a 16.59% price rise over the past 7 days with a further 40% price surge over the past 90 trading days. The 19-month-old cryptocurrency project is now ranked in 11th position as it currently holds a $1.75 billion market cap valuation.
The cryptocurrency will benefit greatly from the recent addition to eToro, further increasing the adoption rate of the coin.
In this article we will take a look at the potential for Tron to rise by 50% in April 2019 and hit the $0.04 level.
Let us take a look at the TRX/USD market and highlight some areas of resistance for the bulls before being able to reach the $0.04 level.
Tron Price Analysis
TRX/USD – SHORT TERM – DAILY CHART

What Has Been Going On?
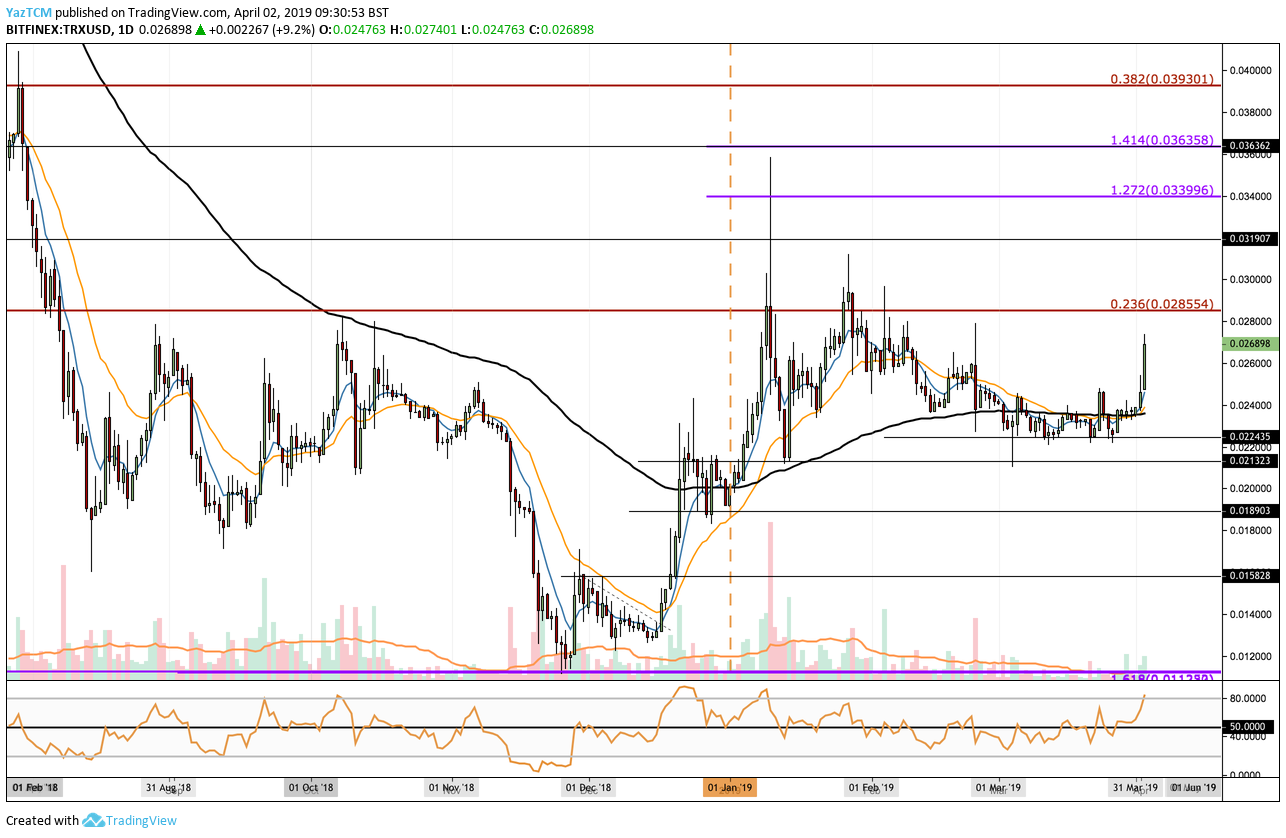
Taking a look at the TRX/USD daily chart above we can see that the market had been trading sideways during the entire month of March 2019. The cryptocurrency was unable to break above the $0.024 handle as it struggled with resistance at the 100 day moving average level. The market had very strong support around the $0.02243 level which had prevented the market from falling lower during March 2019.
During the opening days of April 2019 we can see that TRX/USD had managed to break above the 100 day moving average. The recent Bitcoin surge had then helped TRX/USD to climb above the $0.024 resistance level.
What Is The Short Term Trend For TRX/USD?
The short term trend is currently bullish. For this bullish trend to continue we would need to see TRX/USD breaking above the resistance at $0.03 within the next week or so. If the cryptocurrency falls below $0.022 we can consider the short term trend as bearish.
Where Is The Resistance On The Way Up To $0.04?
If the bulls continue to cause TRX/USD to climb higher we can expect initial resistance to be located at the bearish .236 Fibonacci Retracement level priced at $0.02855. This bearish Fibonacci Retracement level is measured from the high of $0.078 on May 20, 2018 to the December 2018 low.
If the buyers can climb above $0.02855, higher resistance then lies at the $0.030 level followed with more resistance at $0.03190. If the bullish pressure continues to cause TRX/USD to rise further higher we can expect more resistance to be located at the 1.272 and 1.414 Fibonacci Extension levels (drawn in purple) priced at $0.03399 and $0.03635, respectively.
Before being able to test the $0.04 target region the market will first have to overcome some strong resistance at the bearish .382 Fibonacci Retracement level priced at $0.03930.
What Are The Technical Indicators Showing?
The RSI has recently risen into overbought conditions which could signal that the market may need to pull back slightly over the next few days before being able to climb higher. So long as the RSI can remain above the 50 level we can assume that the bulls will maintain control of the market momentum.
Price action has also recently broken above the 100 day moving average. If the 7 day EMA and 21 day EMA can continue to follow suit and break above the 100 day moving average we can expect the surge to increase further.
Conclusion
A 50% surge for Tron in one month is something easily achieved so long as there is no negative news throughout the month to impact the market. Before being able to rise to the $0.04 target the market really needs to focus on breaking above the strong resistance at the $0.030 level. A break above $0.030 would create a fresh 2019 high which would set the stage for TRX/USD to continue the run up to $0.04.

