Ripple has seen a 10% price surge over the past 24 hours, causing the cryptocurrency to rise above the $0.40 level to where it currently trades at $0.4218. Ripple has now seen a mighty turnaround over the past 30 days of trading, which has seen the cryptocurrency increase by a total of 42% allowing Ripple to break out of its 2019 sideways trading range.

Source: CoinCheckup
With the latest price increases, in this article, we will take a look at the resistance for Ripple as it heats up for $0.5. For Ripple to increase and reach the $0.5 target level, the cryptocurrency would need to rise by a total of 18% from the current price of $0.4218. The last time that Ripple was at the $0.5 level was during November 2018 before the November cryptocurrency bloodbath caused a huge market wipeout.
Ripple remains ranked in the 3rd position amongst the top cryptocurrencies by market cap valuation as it currently holds a $17.76 billion market cap value.
Let us continue to take a look at the Ripple market against the US Dollar and highlight some potential areas of resistance on the way toward $0.5.
Ripple Price Analysis
XRP/USD – MEDIUM TERM – DAILY CHART

What Has Been Going On?
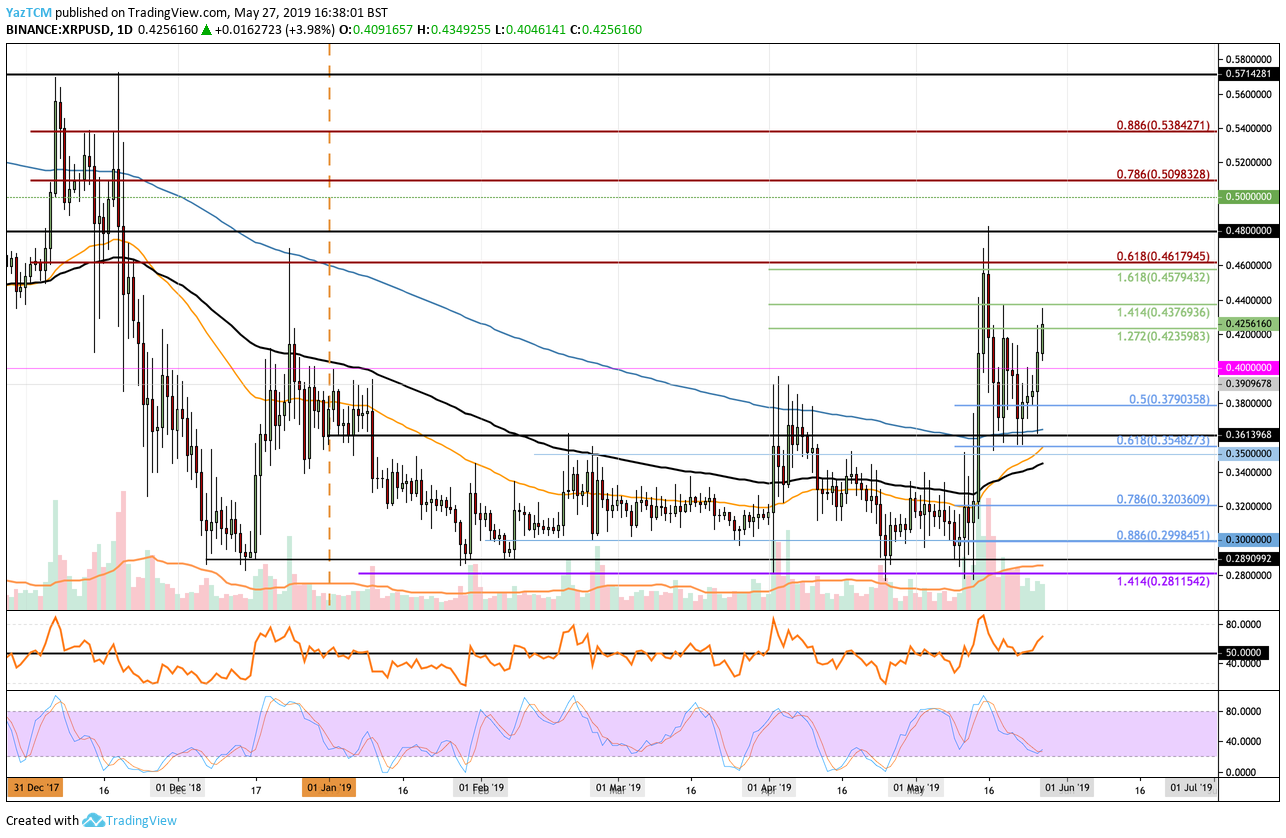
Taking a look at the XRP/USD chart above, we can see that Ripple has increased by a total of 74% from low to high in May 2019. Toward mid-May 2019, we can see that the cryptocurrency began to surge from a low beneath $0.3 to break above both the 100-day moving average and the 200-day moving average level. The cryptocurrency continued to climb further above the 200-day moving average to reach a high at $0.48.
After reaching $0.48, Ripple rolled over and began to decline until reaching support at the 200-day moving average level again at $0.36. Ripple has now, once again, rebounded at this level and now currently trades at the $0.4256 level.
What Is The Current Trend?
As Ripple has managed to remain above the $0.40 level, the current short term trend remains bullish. For this bullish trend to be invalidated, we would need to to see Ripple fall and break beneath the $0.35 support level.
How Realistic Is $0.5?
If the bullish pressure continues above $0.43, we can expect immediate further higher resistance above to be located at $0.4376, $0.44 and $0.46. The resistance at $0.46 is further bolstered by the long term bearish .618 Fibonacci Retracement level (Drawn in red) measured from the November 2018 high to the December 2018 low.
If the buyers continue above $0.46, further higher resistance can then be located at $0.48 and $0.49. If the bulls can clear the $0.49 level, they will be clear to make an attempt at the target level of $0.5.
Above $0.5, further higher resistance can then be found at the bearish .786 and .886 Fibonacci Retracement levels (drawn in red) priced at $0.5098 and $0.5384, respectively.
What If The Sellers Regain Control?
Alternatively, if the sellers regroup and begin to push the market lower, we can expect immediate support beneath the market to be located at $0.4235, $0.41 and $0.40. If the selling continues beneath $0.40, further support can then be expected at the short term .5 and .618 Fibonacci Retracement levels (drawn in blue) priced at $0.3790 and $0.3548, respectively.
What Are The Technical Indicators Showing?
The Stochastic RSI is in a very strong position to provide a bullish crossover signal as it currently trades within extreme oversold conditions. If the crossover occurs, we can expect XRP/USD to continue further higher toward the $0.5 resistance level. Furthermore, the RSI itself has recently bounced from the 50 level which indicates that the bulls remain in control of the market momentum.
Conclusion
The recent price explosion above $0.42 for Ripple has now allowed the cryptocurrency to heat up for $0.5. For Ripple to hit $0.5, we would need to see price action increase by a total of 18%. Ripple will also need to overcome strong resistance at $0.46 and $0.48 before being clear to make an attempt at $0.5.
If the Stochastic RSI signal occurs soon, we could even see Ripple reaching the $0.5 level in the first week of June 2019.

